Report: Trending Progress
Overview
Trending Progress refers to the overtime patterns of work completed over a given a period of time. The report is designed for project managers to access data that help them manage progress tracking by analyzing the trends within the company through a variety of metrics.
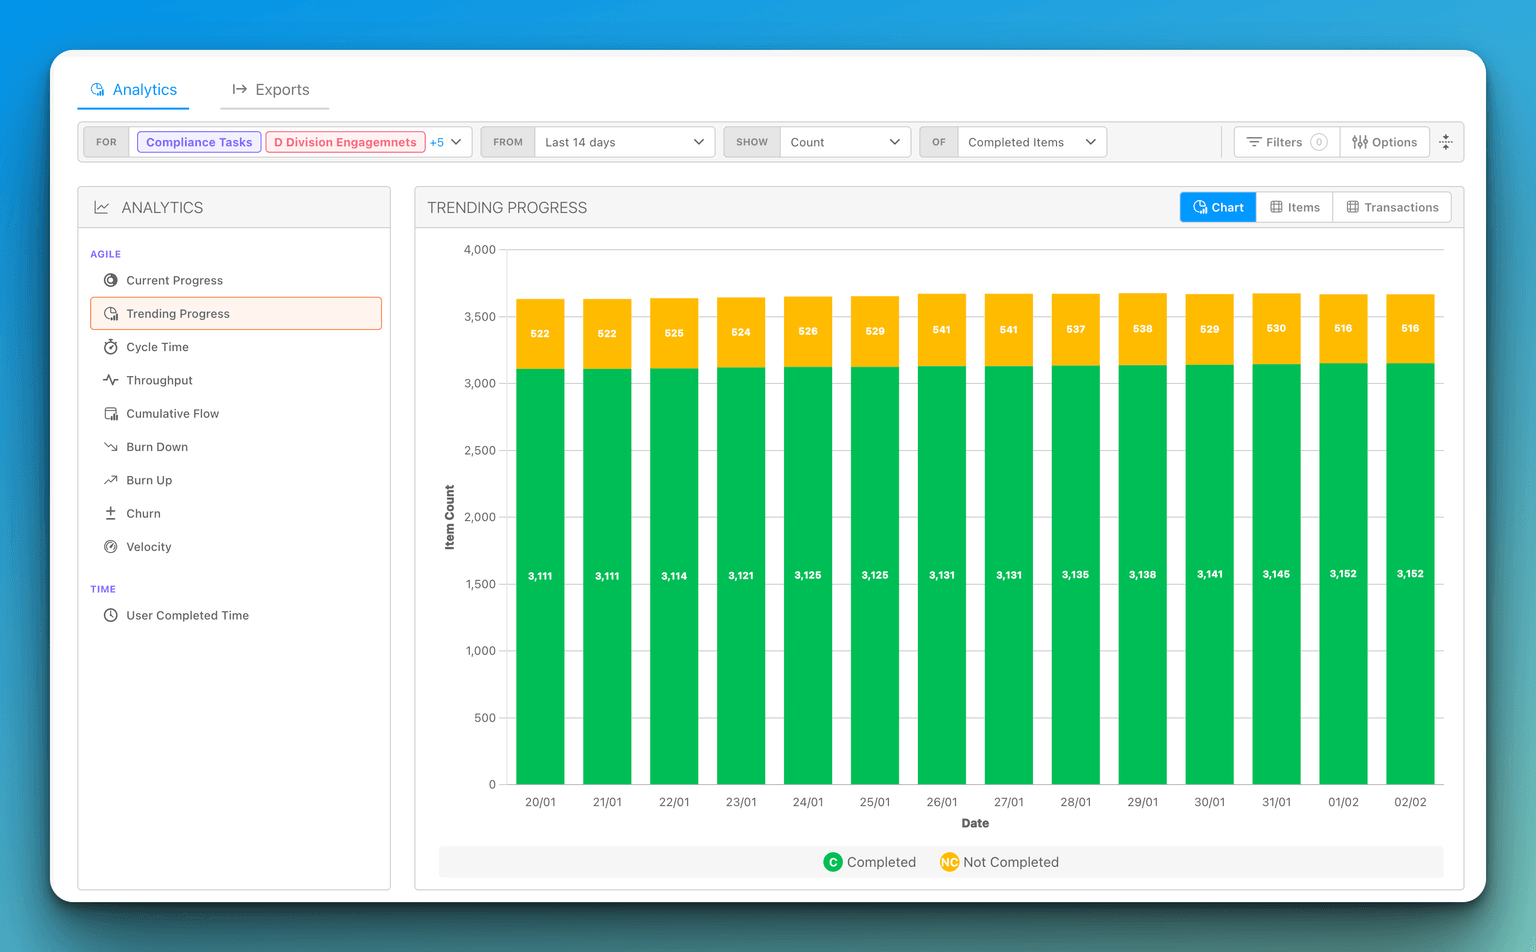
The time axis
The chart draws nothing into the future: its axis runs from the start of your selected range up to and including the current period, which is shown as a partial period holding today's snapshot. Selecting "This Month" on the 2nd therefore shows two days, not thirty columns with two filled. Weekly periods run Monday to Sunday. Choosing a range that lies entirely in the future plots nothing.
Report: Current Progress
Read the Current Progress report's donut charts, drill into the items behind each one, and control how the Planned donut treats completed work.
Report: Cycle Time
Understand the Cycle Time report, its scatter plot, trailing average trend, and how to read the Avg, Min, and Max summary tiles.