Report: Throughput
Throughput answers how much do we finish per period? It counts the items (or hours, or points) that reached a done status in each day, week, or month and draws them as a line, with a trailing average to show the trend. Use it to understand your real delivery rate before you commit to a plan, and to see whether a change in process, team size, or scope moved that rate.
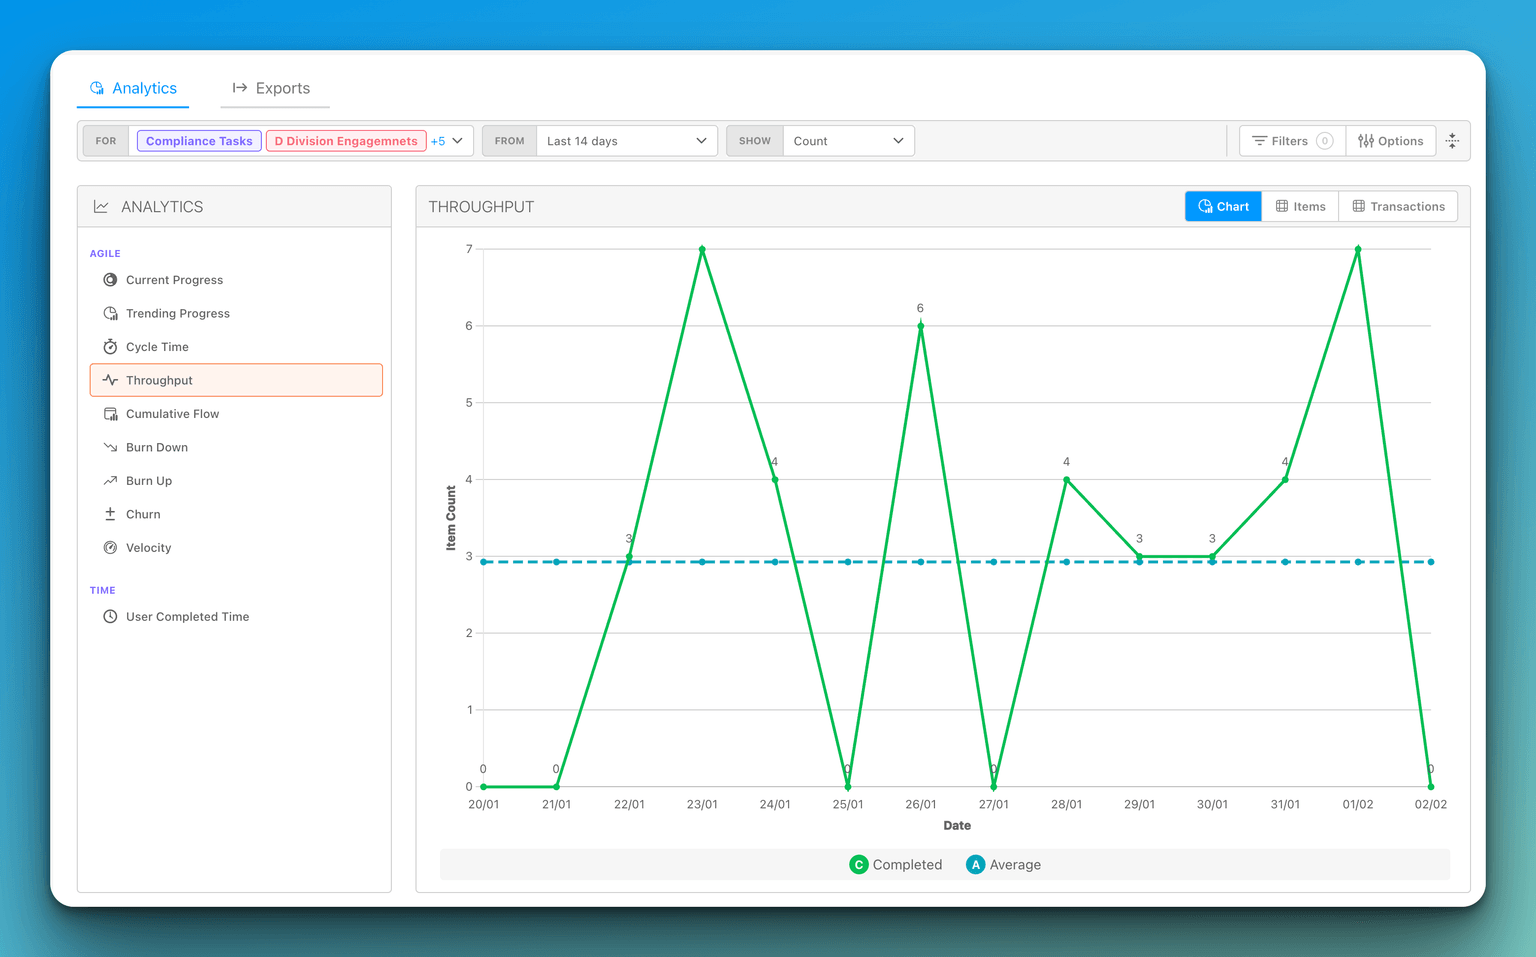
Open and scope it
- Open Measure Performance and pick Throughput under Agile.
- Set the Range. Up to 31 days plots daily, 32 to 92 days weekly, longer monthly.
- Choose Show: Count (default), Time Estimate, Point Estimate, or Time Spent. Estimate options appear only when an item type has that estimate enabled.
- Use For and Filters to pick the team, board, item types, or parent workstream you want to measure.
How throughput is counted
A period's value is the net number of items that moved into a status of type Done during that period: each move into Done adds one, and each move back out of Done subtracts one. An item finished, reopened, and finished again in the same period therefore counts once, and an item reopened in a later period subtracts from that later period.
With Show set to an estimate or time spent, each move is weighted by the item's current estimate or logged time instead of 1.
Period boundaries are aligned to UTC, and weekly periods run Monday to Sunday. The chart draws nothing past the current period, which appears as a partial period.
Reading the chart
- Completed: the solid green line, your throughput for each period.
- Trailing Avg: the dashed gray line with a shaded area. Each point averages that period with the two before it; at the start of the range it averages whatever periods exist.
When the Completed line sits above the Trailing Avg for several periods, delivery is accelerating; when it sits below, it is slowing. The Trailing Avg uses the same unit you chose in Show.
Example. Weekly throughput reads 12, 11, 13, 4, 12, 12. The 4 is a holiday week, and the Trailing Avg barely dips because it is averaged with its neighbours. If the next three weeks read 6, 5, 6 instead, the average follows them down and the drop is real: look at Cycle Time to see whether items are taking longer, or Cumulative Flow to see where they are stuck.
Items and Transactions tabs
The Items tab lists the items completed in each period with Item, Completed, Point estimate, Time estimate, and Hrs Spent columns and an N items count per period. The Transactions tab shows the individual moves into and out of Done.
Pitfalls
- Items created directly in Done are not counted. The report counts status changes; an item created already finished never moved into Done. The same applies to imported items that arrive in a done status.
- Net, not gross. A period can read lower than the number of items that actually finished in it if items were reopened in the same period.
- Estimates are current values. Re-estimating items today changes the hours or points shown for past periods.
Related: Velocity is throughput per cycle rather than per calendar period.
Report: Cycle Time
Measure how long items take to move from one status to another, read the scatter plot and trailing average, and understand exactly which status changes are timed.
Report: Cumulative Flow
See how many items sit in each status over time, and use the width of each band to find where work is piling up.