Report: Cumulative Flow
Overview
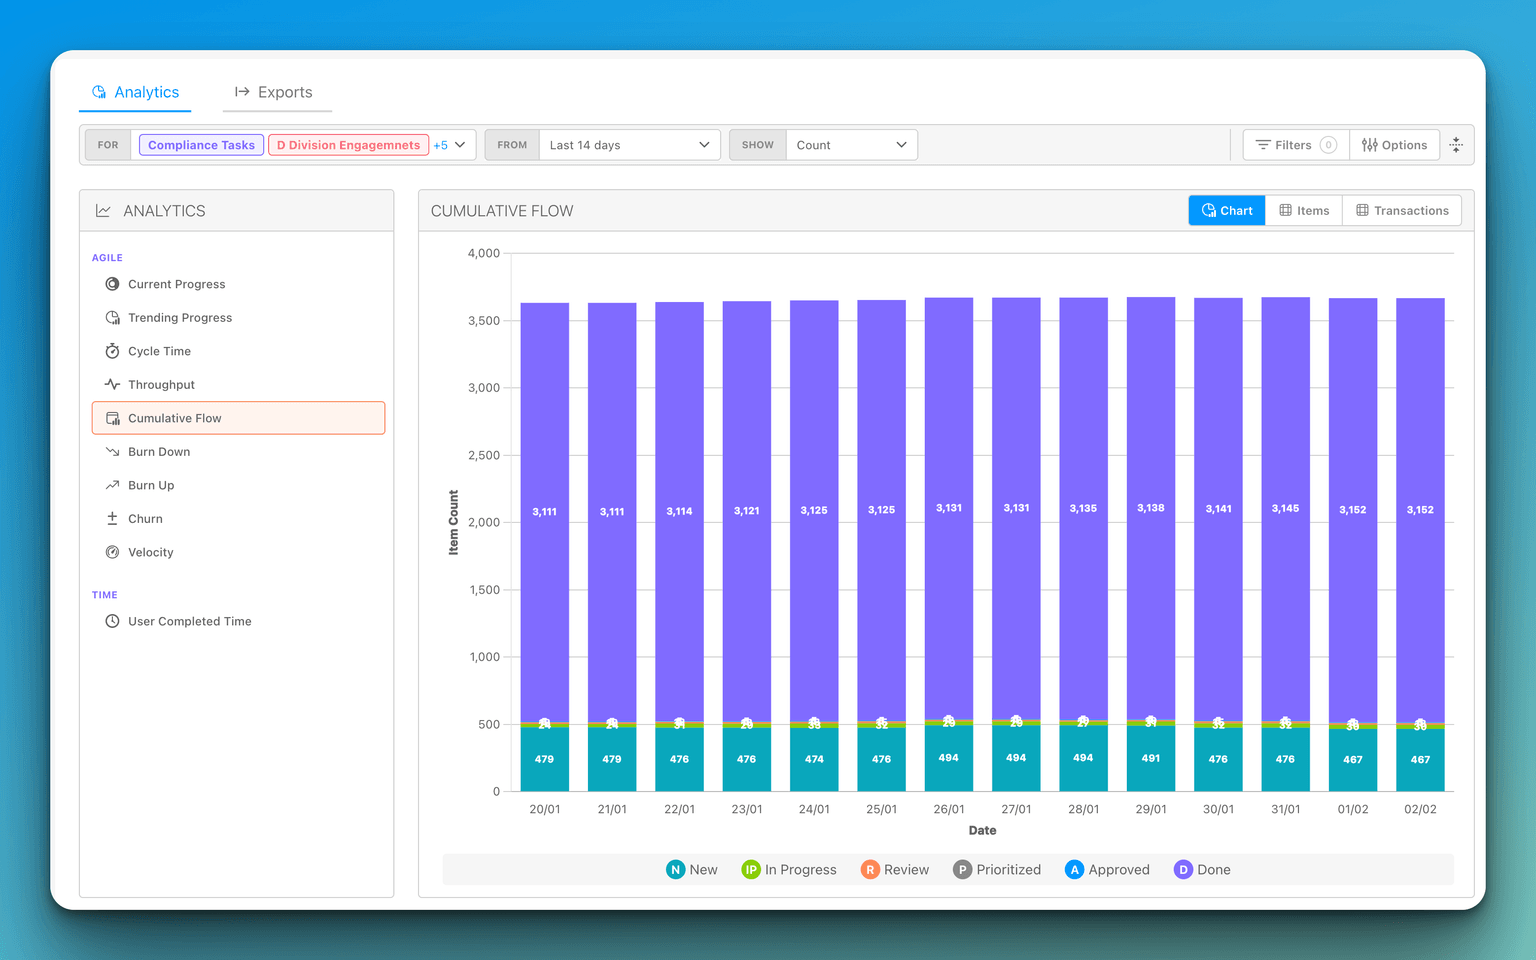
Cumulative Flow is a visual representation of the flow of work items through a team's workflow over time. It is a chart that shows the number of work items in each status of the workflow at any given time, and it provides a snapshot of how work is progressing through the system.
The chart is built by plotting the number of work items in each status of the workflow over time. The horizontal axis represents time, while the vertical axis represents the number of work items. Each status of the workflow is represented by a different colored band.
The time axis
The chart draws nothing into the future: its axis runs from the start of your selected range up to and including the current period, which is shown as a partial period holding today's snapshot. Selecting "This Month" on the 2nd therefore shows two days, not thirty columns with two filled. Weekly periods run Monday to Sunday. Choosing a range that lies entirely in the future plots nothing.