Track Progress: Setting Up Gantt Charts
A Gantt chart in DevStride is a timeline view over work that already lives in your workstreams and boards. You do not re-enter tasks. You create a chart, give it one or more initiatives to hold the work, then import existing workstreams and items into those initiatives. Every bar you then drag writes real dates back to the real item.
This page gets you from an empty Track Progress module to a populated chart. Once the chart exists, continue with Viewing Gantt Charts, Navigating the timeline, and Navigating the table.
Before you start
| You want to | You need |
|---|---|
| Open Track Progress and view any chart | ACCESS_GANTT |
| Create a chart | CREATE_GANTT |
| Edit or delete a chart you created, its initiatives, milestones, scenarios and imported items | MANAGE_OWN_GANTTS |
| Edit or delete charts other people created | MANAGE_ALL_GANTTS |
| Create or rename Gantt groups | MANAGE_OWN_GANTTS or MANAGE_ALL_GANTTS |
| Move bars or edit cells for a given workstream or item | Edit rights on the chart and update access to that item (MANAGE_OWN_ITEMS_AND_WORKSTREAMS plus the item's own permissions) |
Every chart is visible to everyone who can open the module. If a menu entry is greyed out, hover it: the tooltip names the permission key you are missing. See Roles and Permissions.
Step 1: Create a Gantt group (optional)
Groups are folders in the chart picker. Skip this if you only have a few charts; charts with no group appear under Other.
- Open Track Progress from the left navigation.
- Click + Create in the top-right, then Gantt Group.
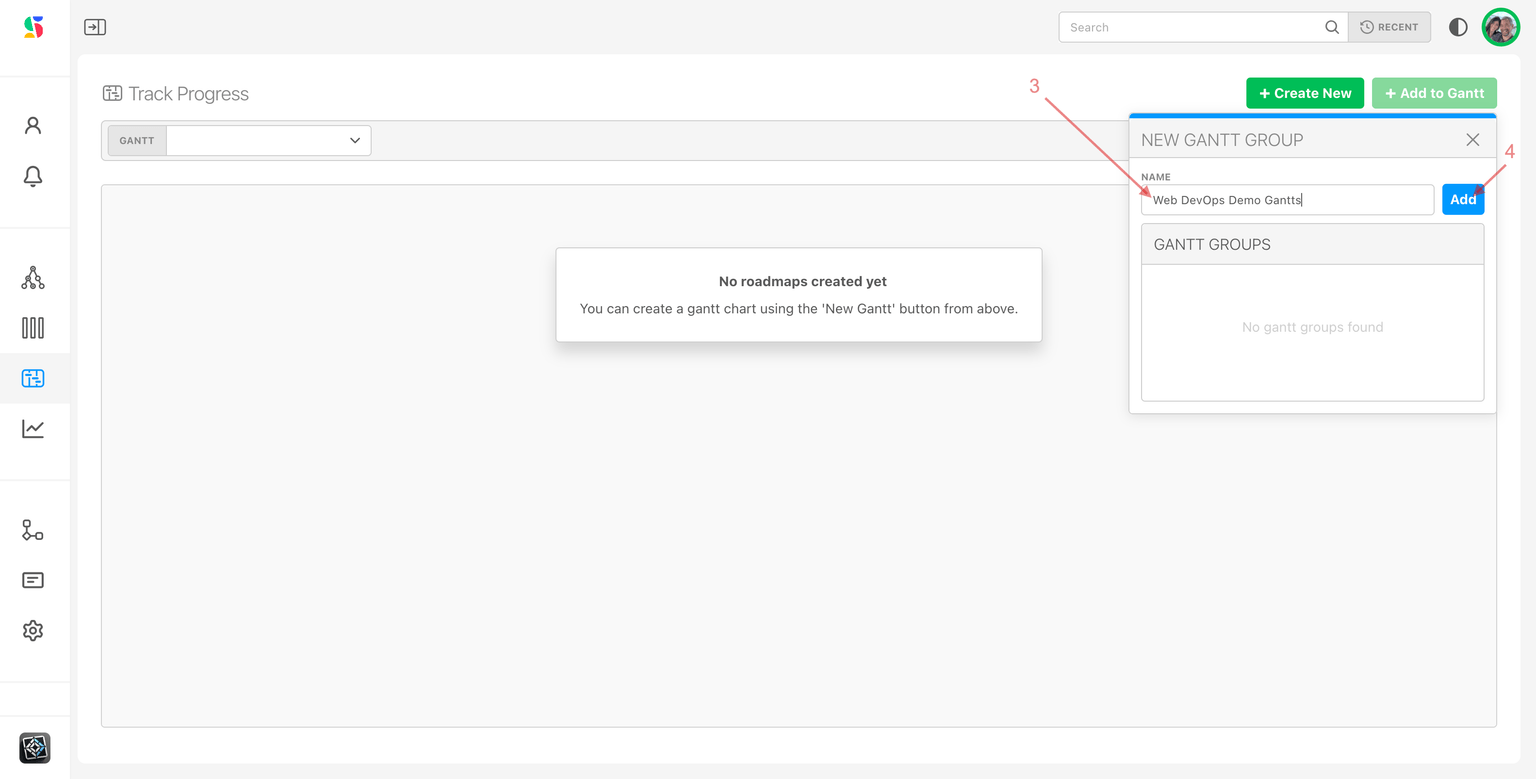
- In Manage Gantt Groups, type a name (at least 3 characters), optionally Add a Description, and add it. Existing groups are listed in the same dialog, where you can rename or delete them.
- Click Done.
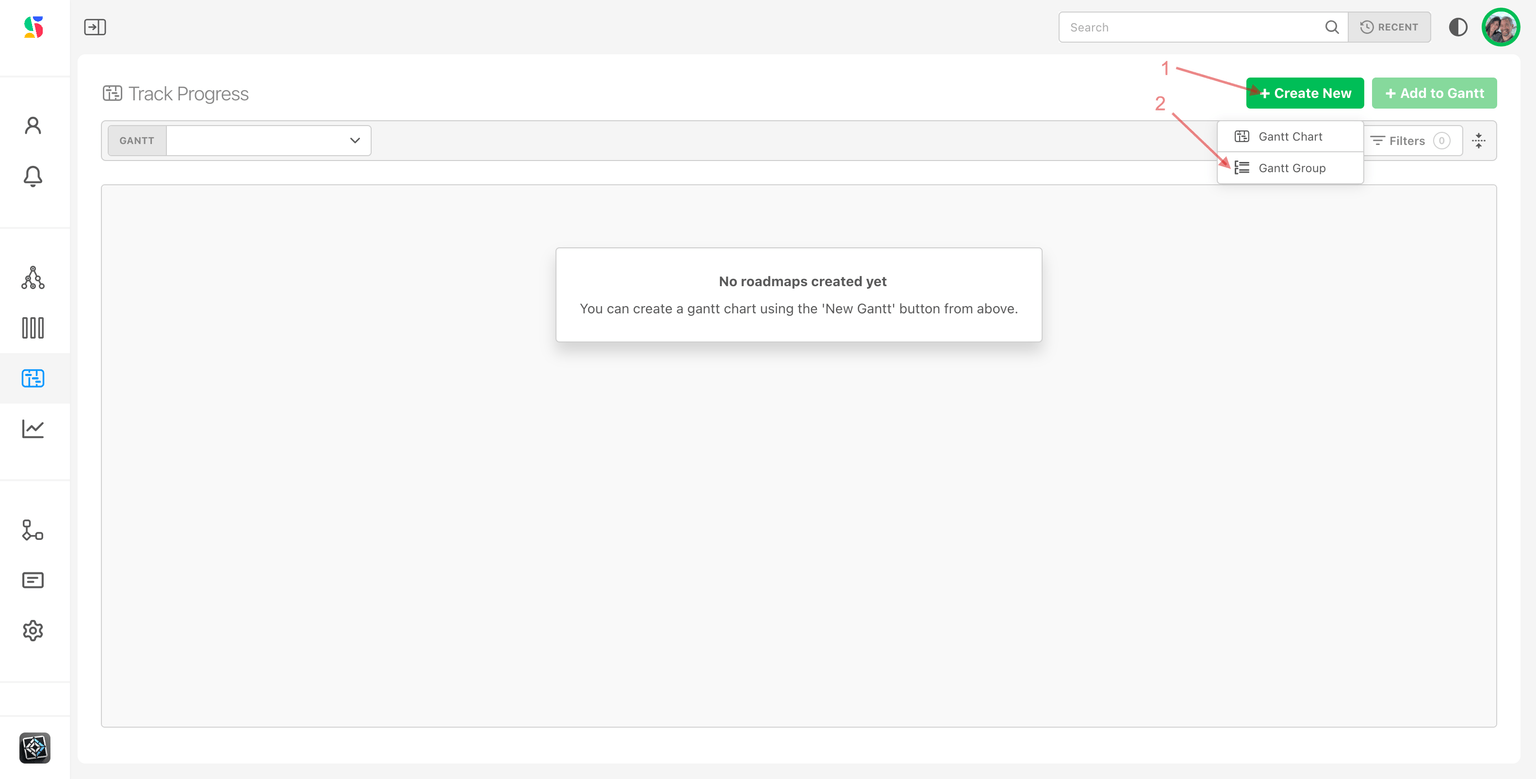
Good group names describe an audience or a portfolio: "Web DevOps Gantts", "Product Marketing", "Initiative X".
Step 2: Create the chart
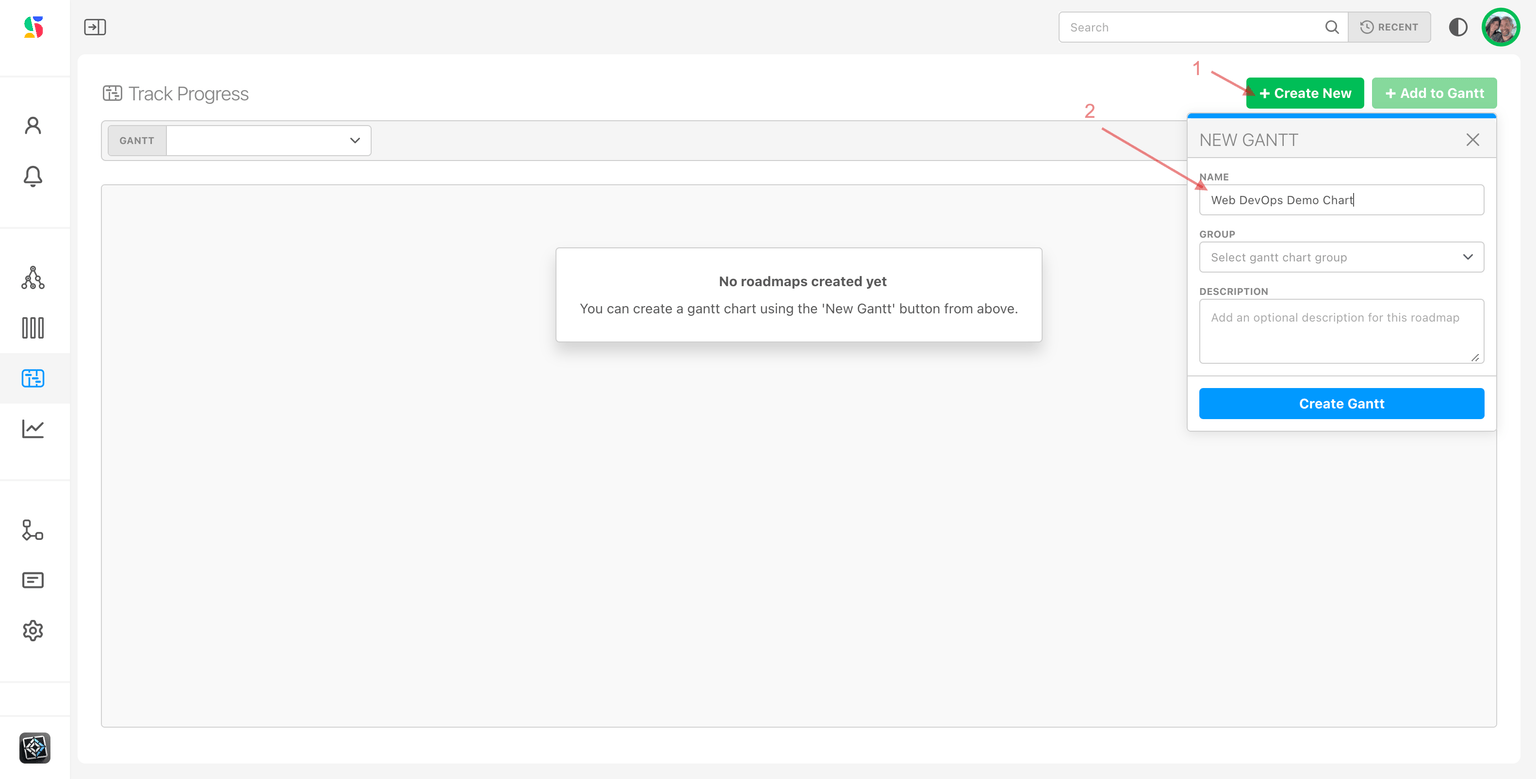
- Click + Create, then Gantt Chart.
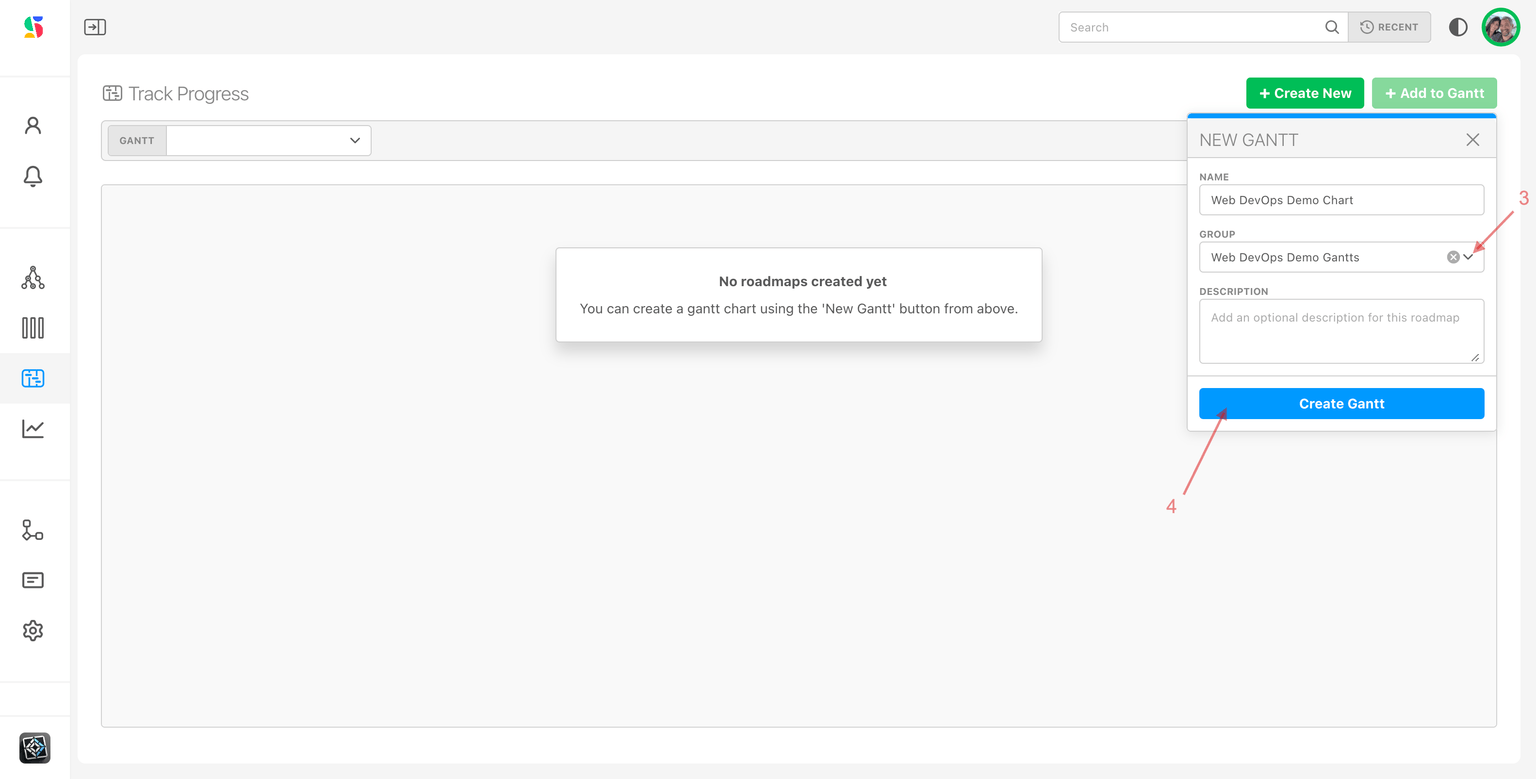
- In New Gantt, enter a Name (at least 3 characters), pick a Group if you made one, and add an optional Description. The description shows next to the chart name above the table.
- Click the create button. The new chart opens and is selected in the Gantt picker on the left of the filter bar.
To rename a chart or change its group later, click Edit gantt details (pencil) next to the chart name. Delete this gantt sits beside it. Deleting a chart removes the chart, its initiatives, milestones and scenarios; it never deletes the workstreams or items that were on it.
Step 3: Add an initiative
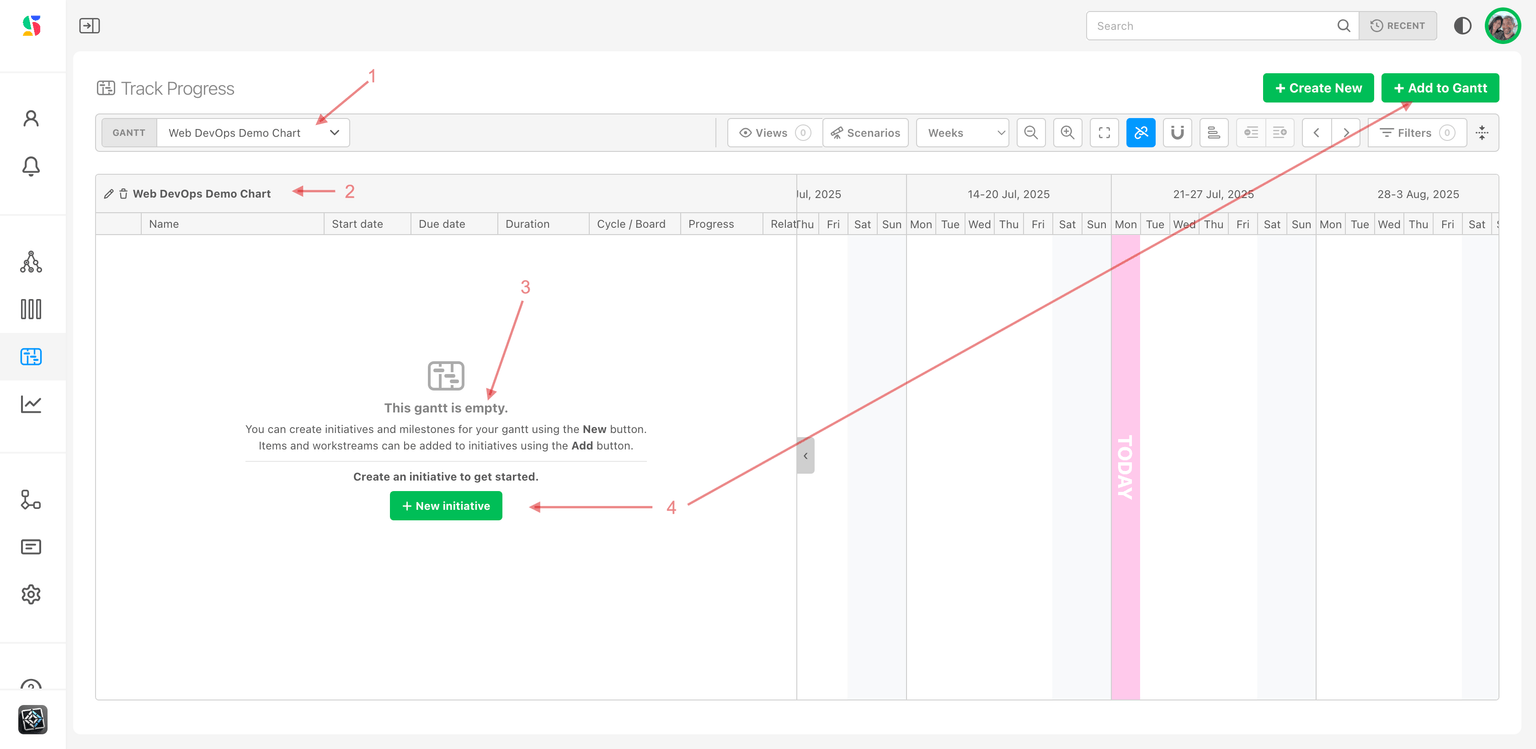
A new chart is empty and tells you so: Create an initiative to get started. Initiatives are the top-level rows. They exist only on the chart, and every imported workstream or item sits under one of them.
- Click + New initiative in the empty state, or + Create then Initiative.
- In New Initiative, enter a Name, an optional Description, and pick a Color. The color is used for the initiative's bounding box on the timeline.
- Click the create button.
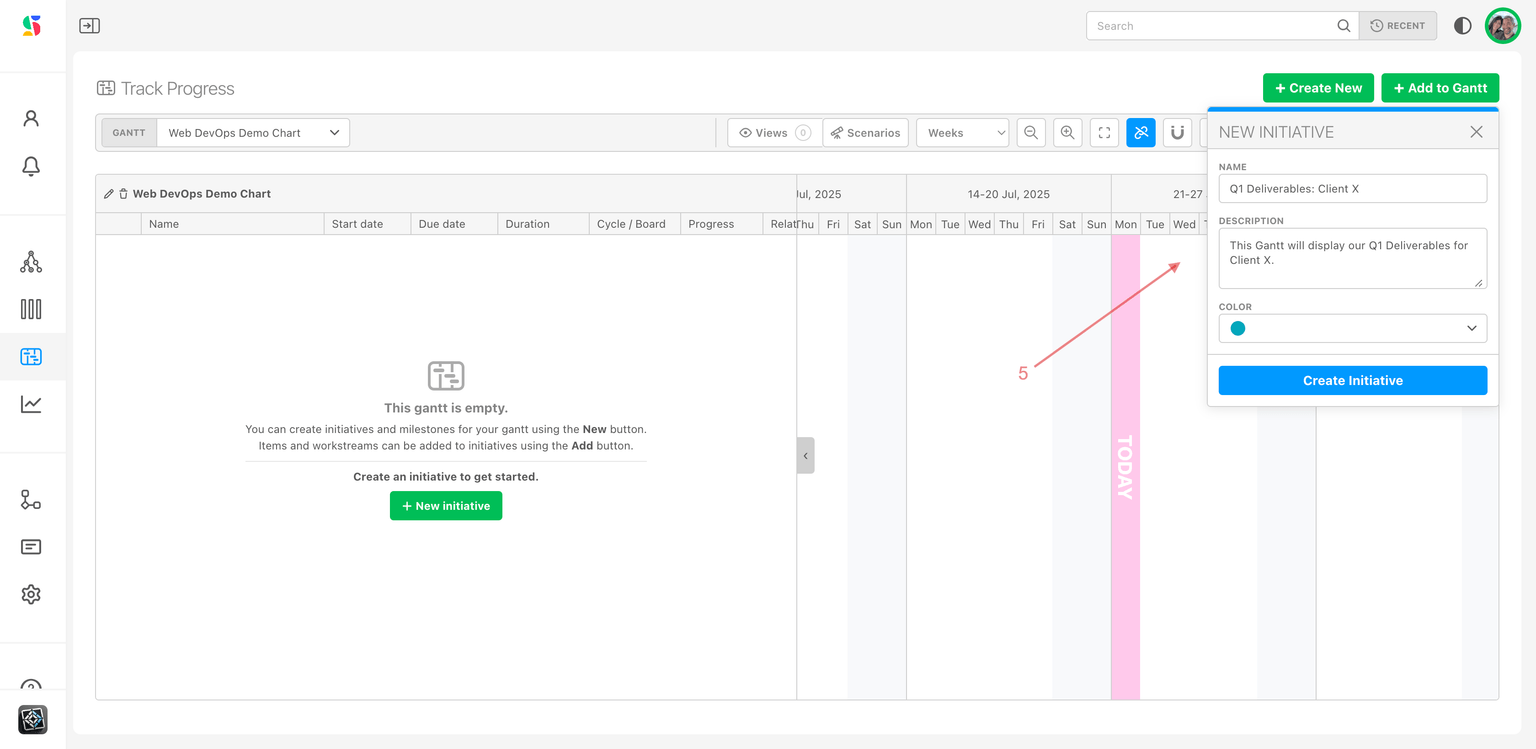
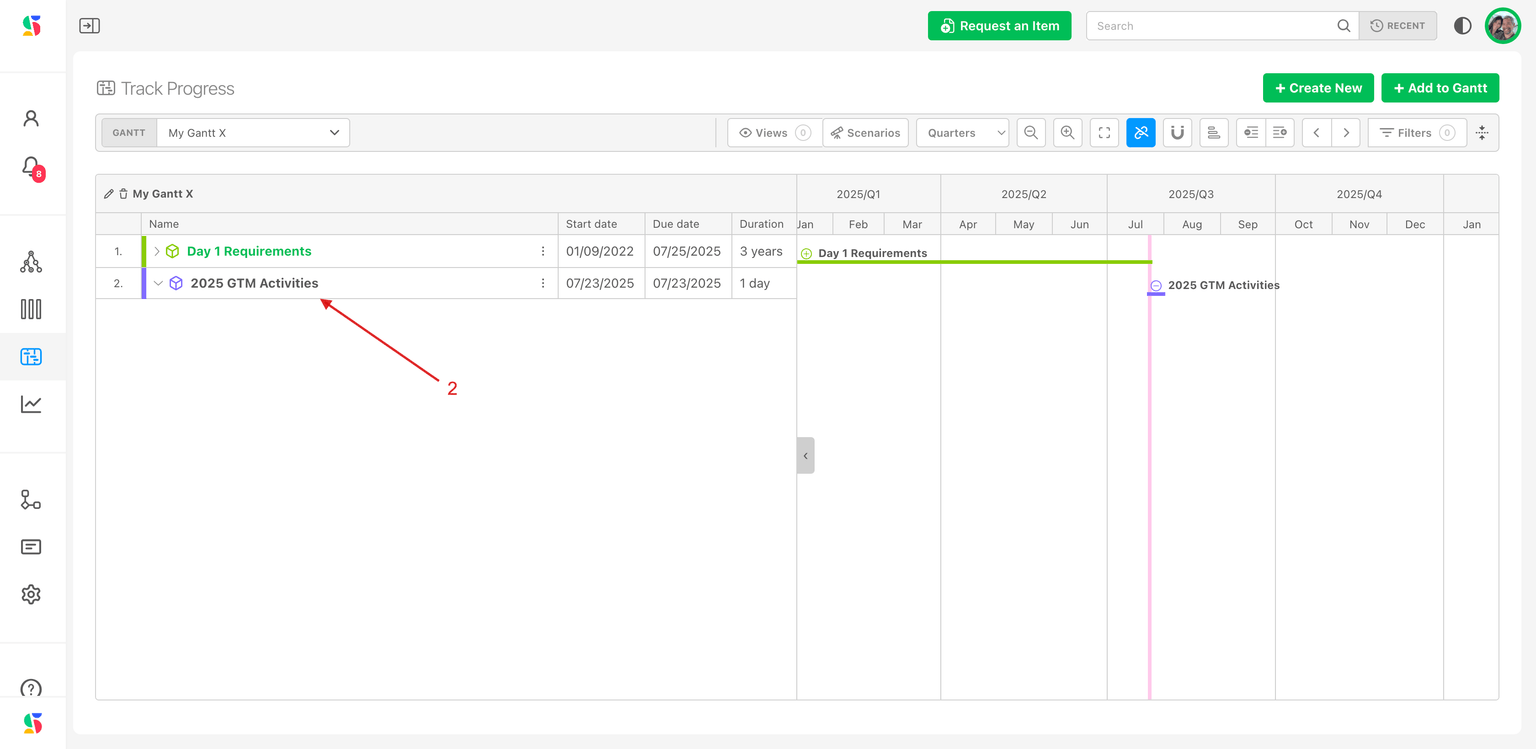
Initiative dates are never typed in. The start date is the earliest date among everything inside it and the due date is the latest, so the bar grows as you add work. Hovering the initiative's dates in the table shows the tooltip Initiative dates are inferred from the workstreams and items they contain.
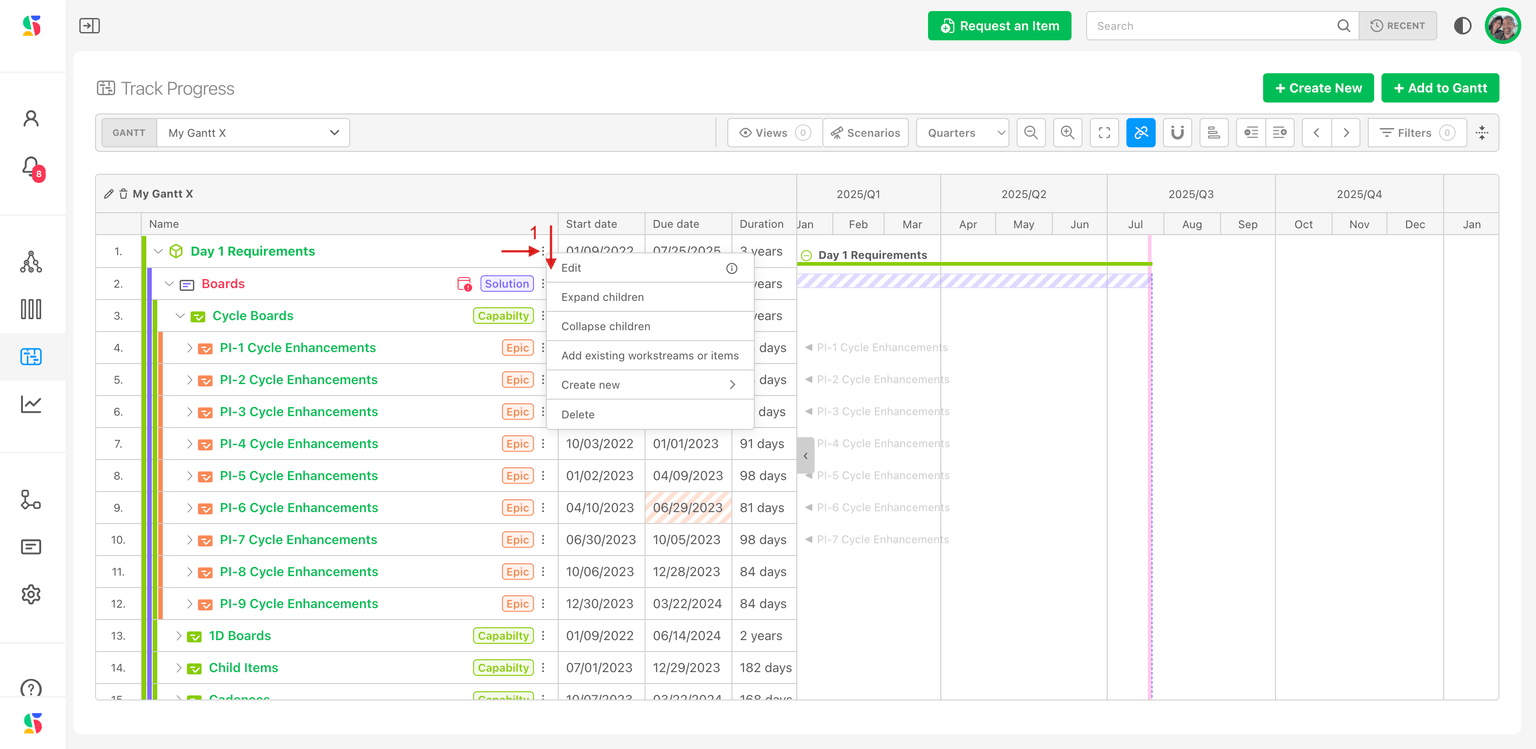
Click Options (the vertical dots at the end of the row) to edit the initiative, add work to it, or delete it. You can create as many initiatives as you need; one per team, quarter, or program is common.
Step 4: Import the work you want to track
- Click Import in the top-right. It is disabled until the chart has at least one initiative.
- In Add to initiative, choose the Initiative.
- Click Items / Workstreams and pick from your workstream map. You can select whole workstreams (their children come with them) or individual items, from any level and any board. Workstreams and items already on the chart are disabled in the picker.
- Click Add Items.
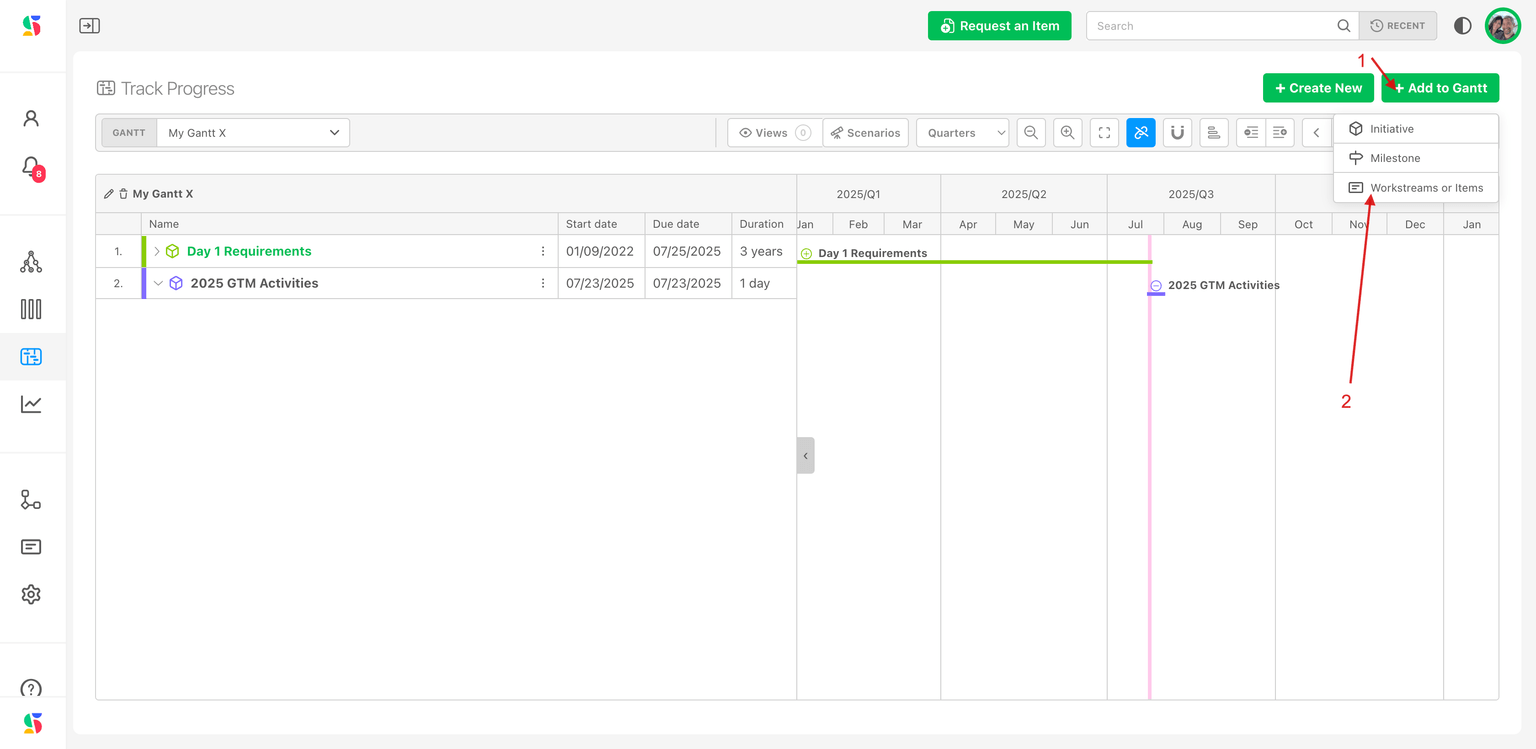
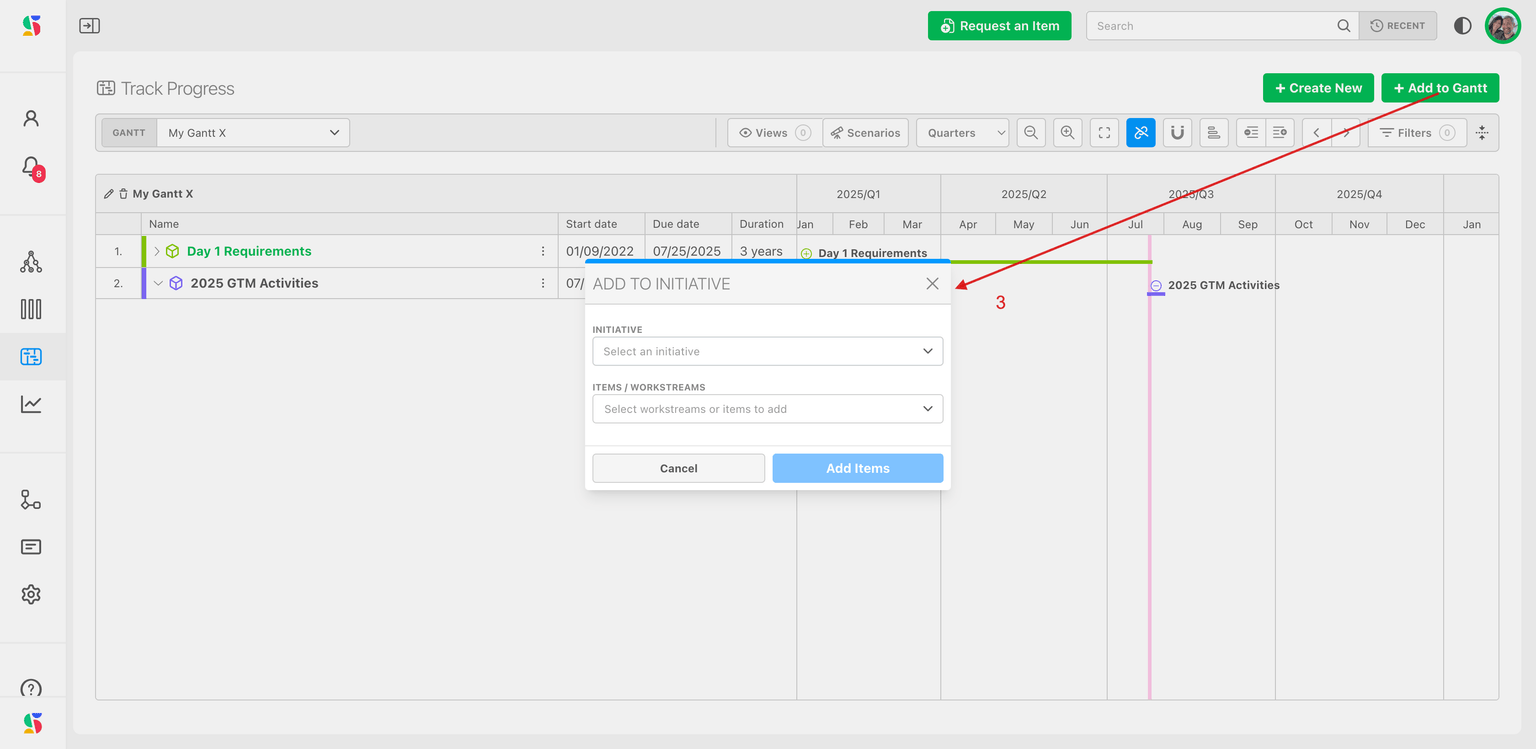
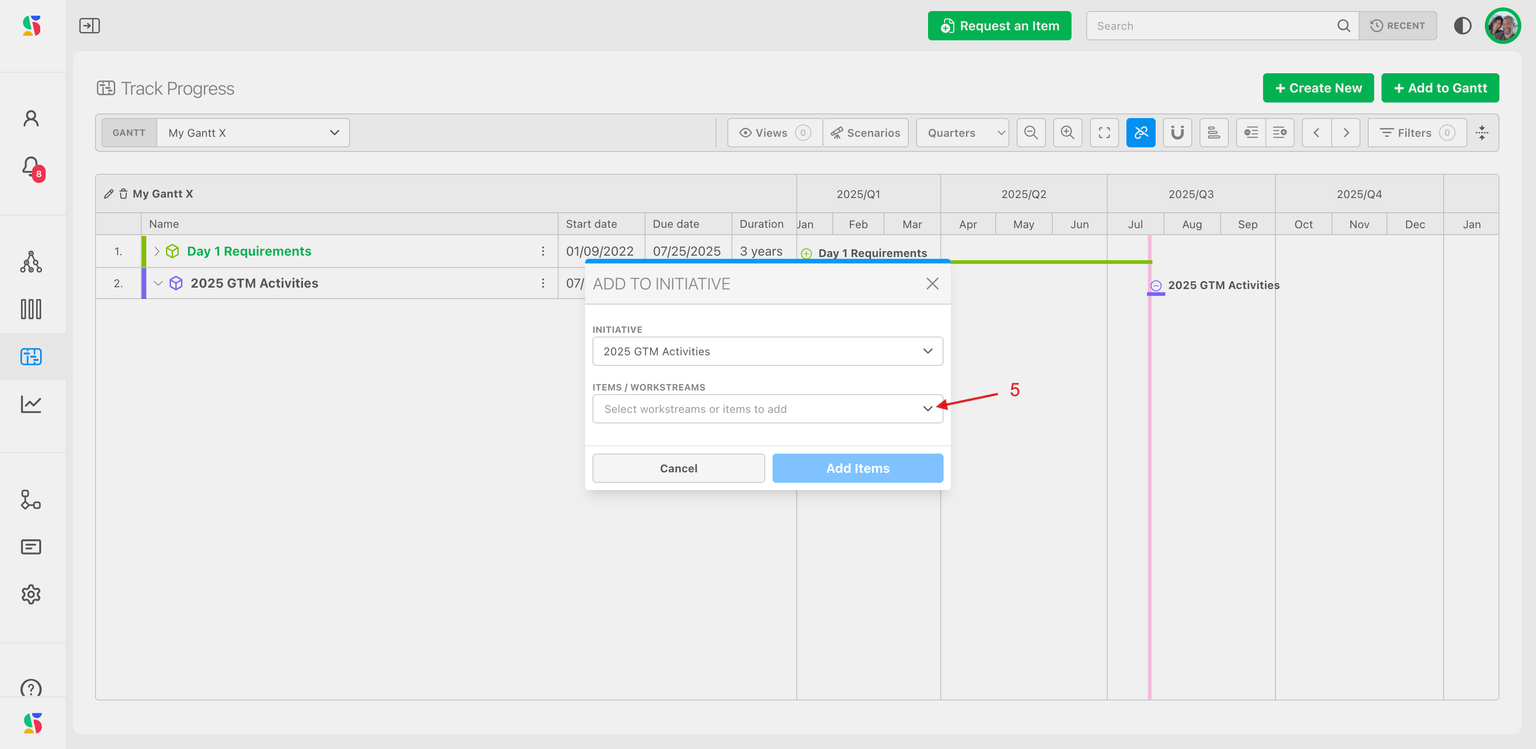
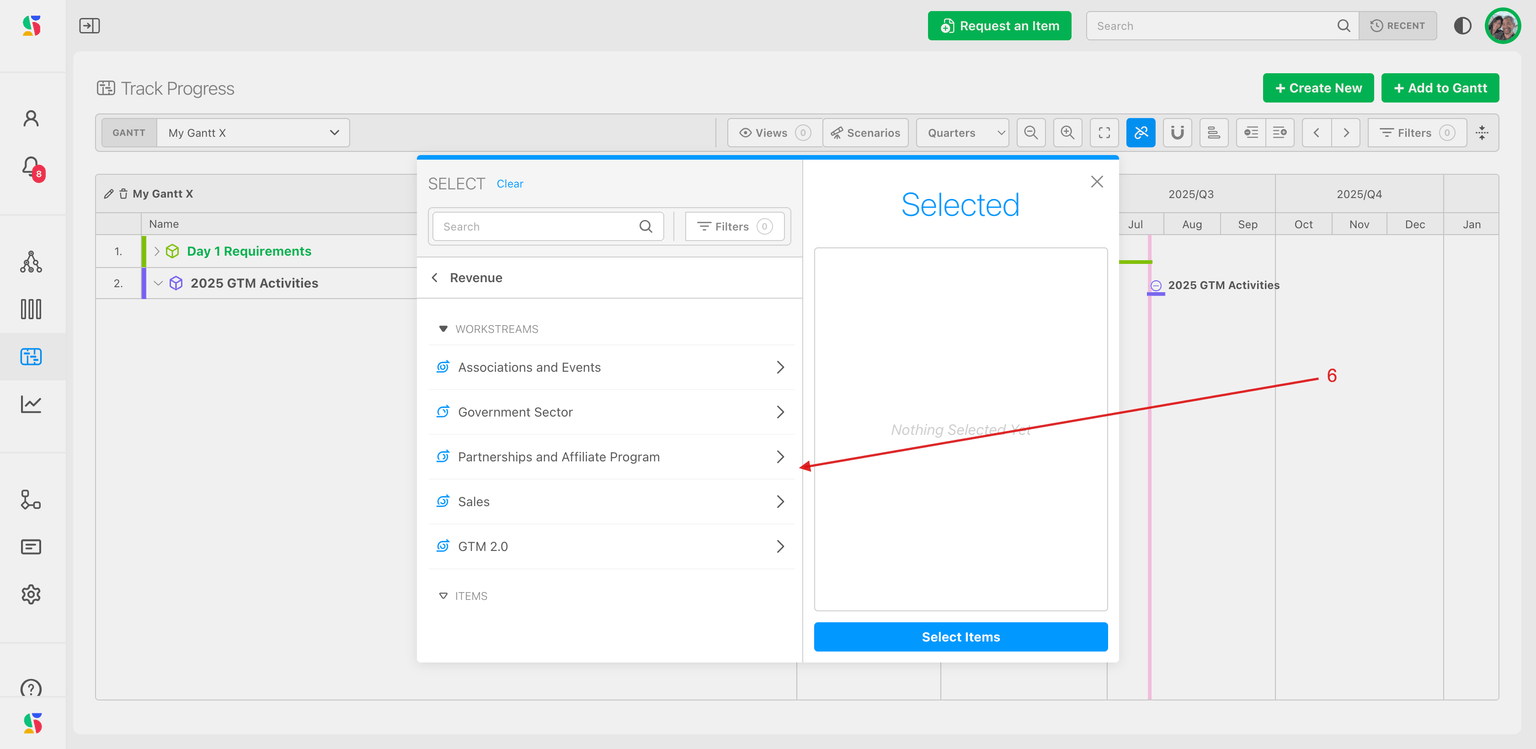
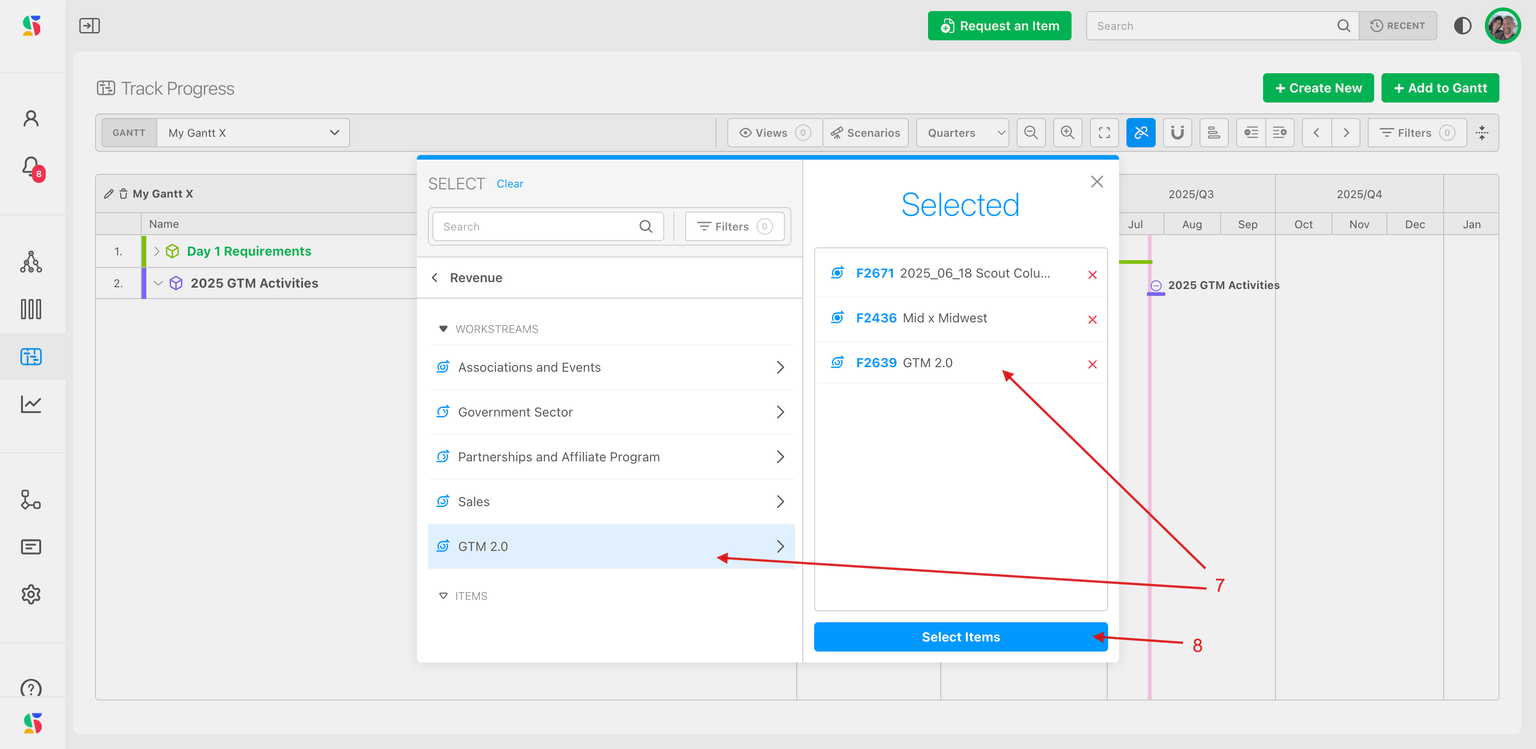
Other ways to get work onto a chart:
- From an initiative row: Options then Add existing workstreams or items opens the same dialog with the initiative preselected.
- Create new work from the chart: Options on an initiative or workstream row, then Create new and Work item or Workstream. This creates a real item in that workstream (you need
CREATE_ITEMS_AND_WORKSTREAMS). The dialog's Insert after the other Item(s) checkbox, ticked by default, puts it at the bottom of its siblings; untick it to put it at the top. - From the Items Table or the Map: select items, open the bulk action menu and choose Gantt. The Add to Gantt dialog asks for the Gantt and the initiative (or lets you create a new initiative in place). See Add to Gantt.
To take something off the chart, open Options on a first-level row and choose Remove from gantt. This only removes it from the initiative; the item itself is untouched.
Where the dates come from
The timeline only shows what has a start date and a due date. The chart reads those straight from the items, so:
- Items that already carry dates appear in place immediately.
- Items with no date show Date missing in the Start date or Due date column and a placeholder bar at an inferred position. Shift + click the cell to accept the inferred date, or set a real one.
- Workstreams whose children spill outside their own dates get a shaded hint in the date cell; Shift + click snaps the workstream to its earliest or latest descendant.
- Items on cycle (time-boxed) boards take their cycle's dates only if the organization setting Sync work item dates with their cycles is on (Configure Settings → Admin → Global Automations). Otherwise they need dates like any other item. See Using cycle boards.
Step 5: Choose the time scale
Use the Horizontal zoom slider in the control bar, or click the number next to it (pixels per day) to pick from the ten presets, from Years / Quarters down to Days. Double-click an empty part of the timeline to zoom in one step; Shift + double-click zooms out. New charts open at the 4 px/day quarters view. Full details are in Navigating the timeline.
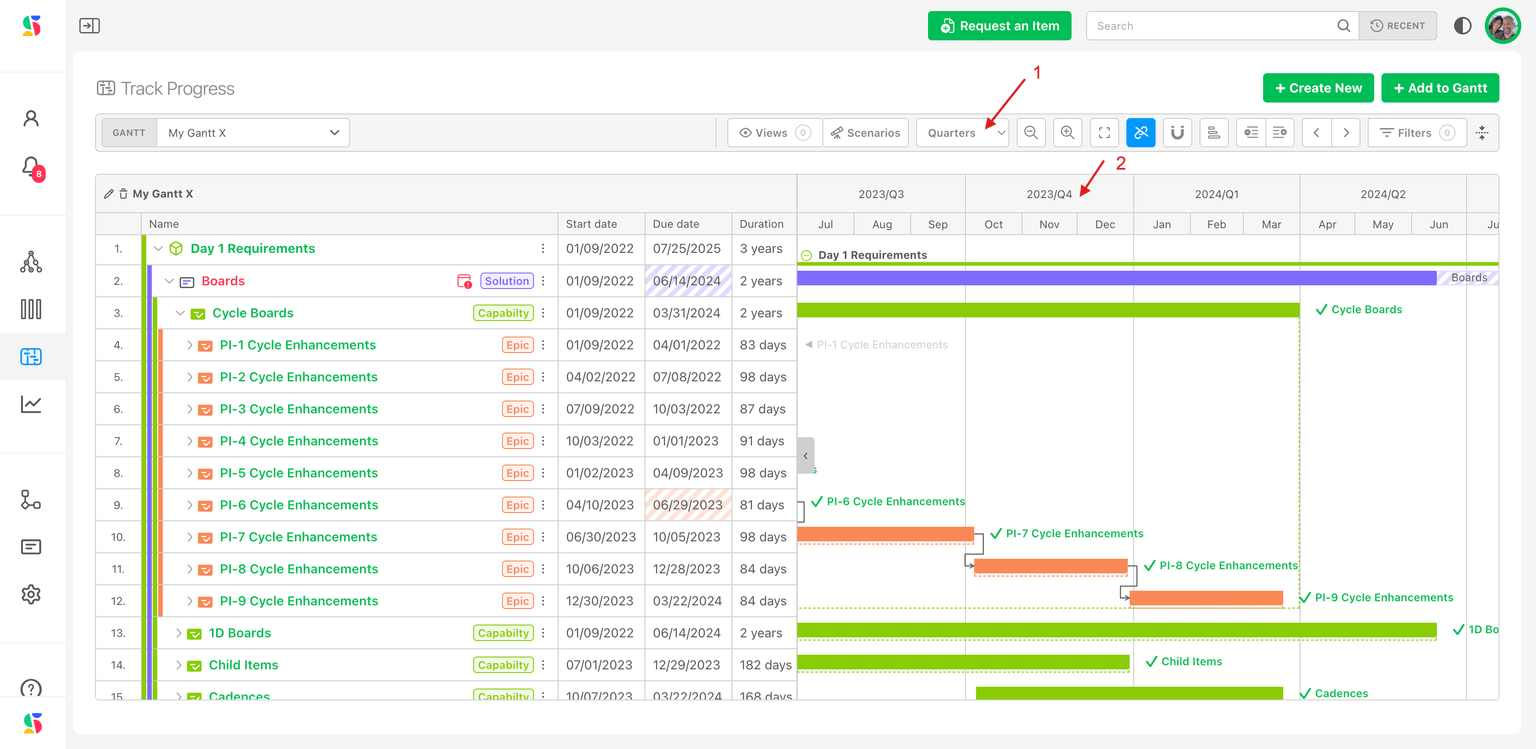
Step 6: Snap to a team's cycles
Snap to cycles (magnet icon) overlays one board folder's cycles, such as a team's sprints or program increments, as bands behind the bars, so you can read any chart through that team's calendar.
- Click the magnet. The tooltip reads Map a board folder to the gantt for better date management across cycles.
- In Select board folder, expand to the folder whose cadence you want and click Select. The folder's cadence is shown next to each folder to help you choose.
- The cycles appear as alternating bands with their names in the header. Zoom to months or weeks to read sprint names comfortably.
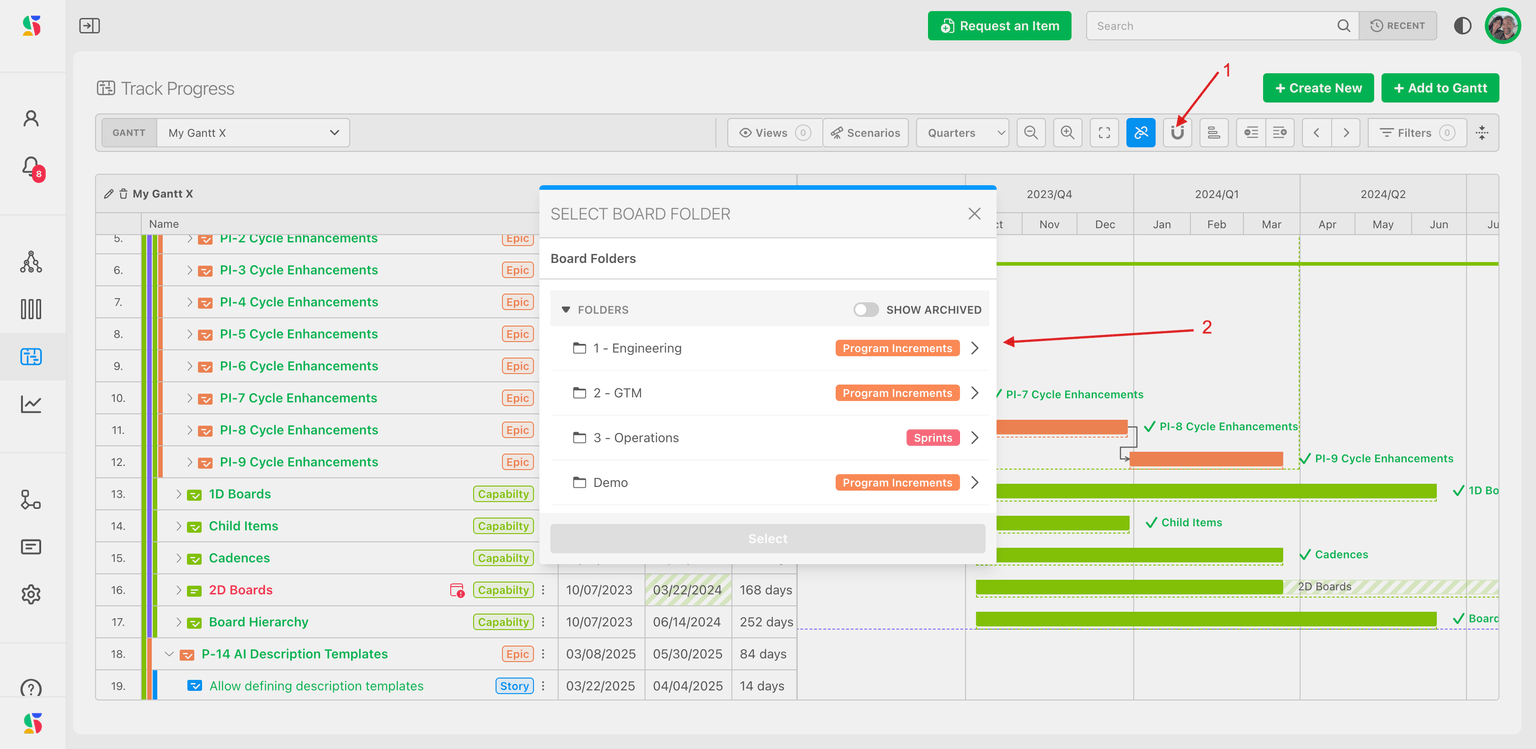
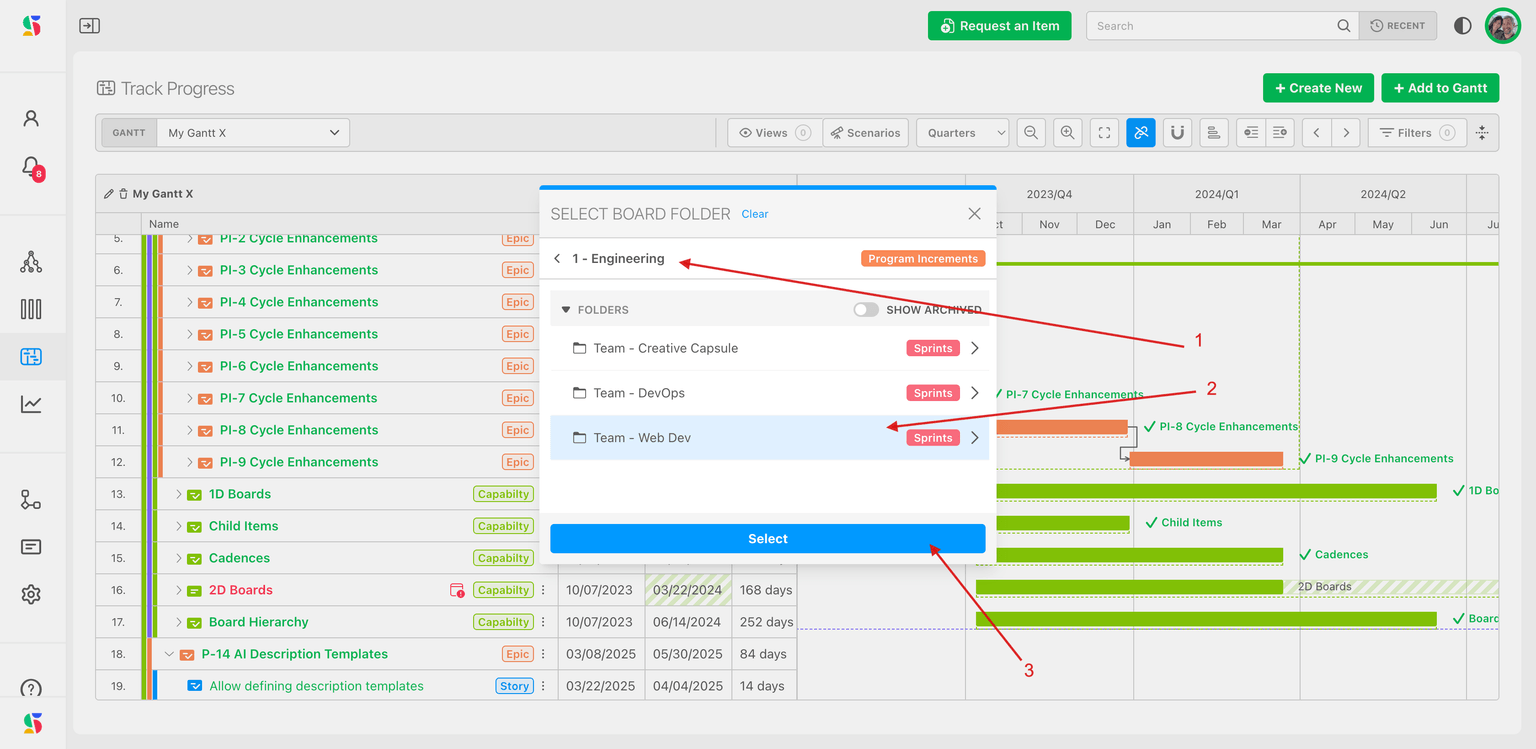
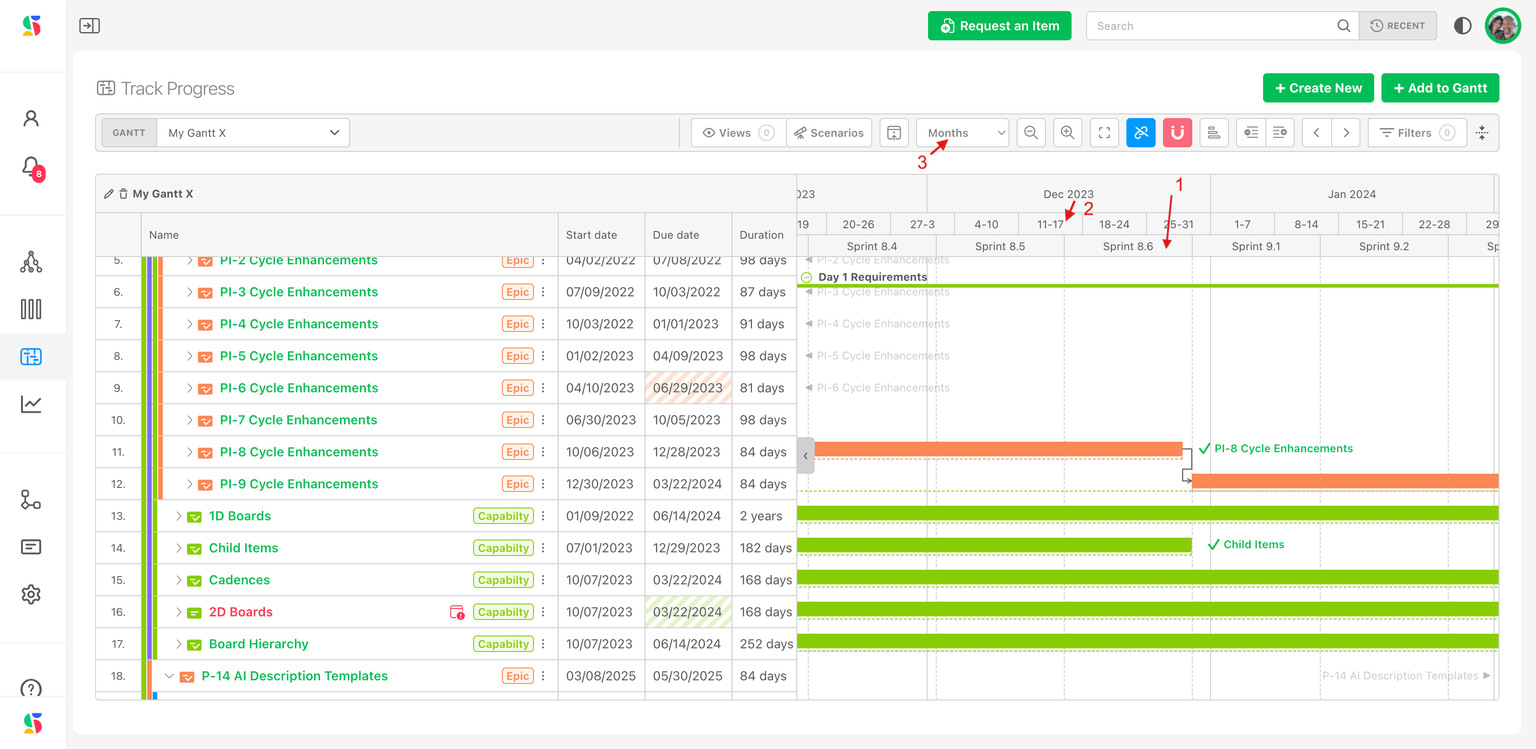
Snapping changes how dragging behaves for work items: a bar cannot be dragged across a cycle boundary, and dropping a bar inside a cycle moves the item onto that cycle's board. Read Navigating the timeline before you drag with cycles on. The selection is not saved with the chart; set it each time you open the chart.
What to do next
- Viewing Gantt Charts: pick charts, expand levels, filter, save views.
- Navigating the timeline: move bars, draw dependencies, zoom and pan.
- Navigating the table: the columns and what you can edit in them.
- Link Mode: decide whether a slipped date should push dependent work.
- Scenario Planning: try date changes without committing them.
Board & Folder Permissions
Control who can view, edit, and manage your boards and folders with user, team, and organization-level permissions, and how folders pass access down to everything inside them.
Viewing Gantt Charts
Pick a chart, read the bars and rollups, expand to the level you need, filter to one team, look through another team's cadence, and save the result as a shareable view.