Track and Move Work with Board Views
- 19 Jul 2025
- 4 Minutes to read
- Contributors

- Print
- DarkLight
Track and Move Work with Board Views
- Updated on 19 Jul 2025
- 4 Minutes to read
- Contributors
- Print
- DarkLight
Article summary
Did you find this summary helpful?
Thank you for your feedback!
Overview
In Plan Delivery, DevStride board features offer a wealth of information at a glance. Following is an summary of what is available on each kind of board view.
These capabilities apply to both perpetual boards and cycle-based boards.
How to Use Boards
Step 1: Open a board from your working group folders
From Plan Delivery, navigate to the perpetual or cycle board you wish to view and click Go.
See this article for more on how to navigate to the board you wan to see.
Step 2: Track and Move Work
You can track and move work in your boards by any or all of the following views:
- Status View
- Table View
- 2D View
Here's how to interact with each view.
Status View
The default view for boards is the Status view. Drag item cards between status columns as work progresses.
Use filters (by cadence, status, team, etc.) to focus on specific work.
Here's how items look on the Status view:
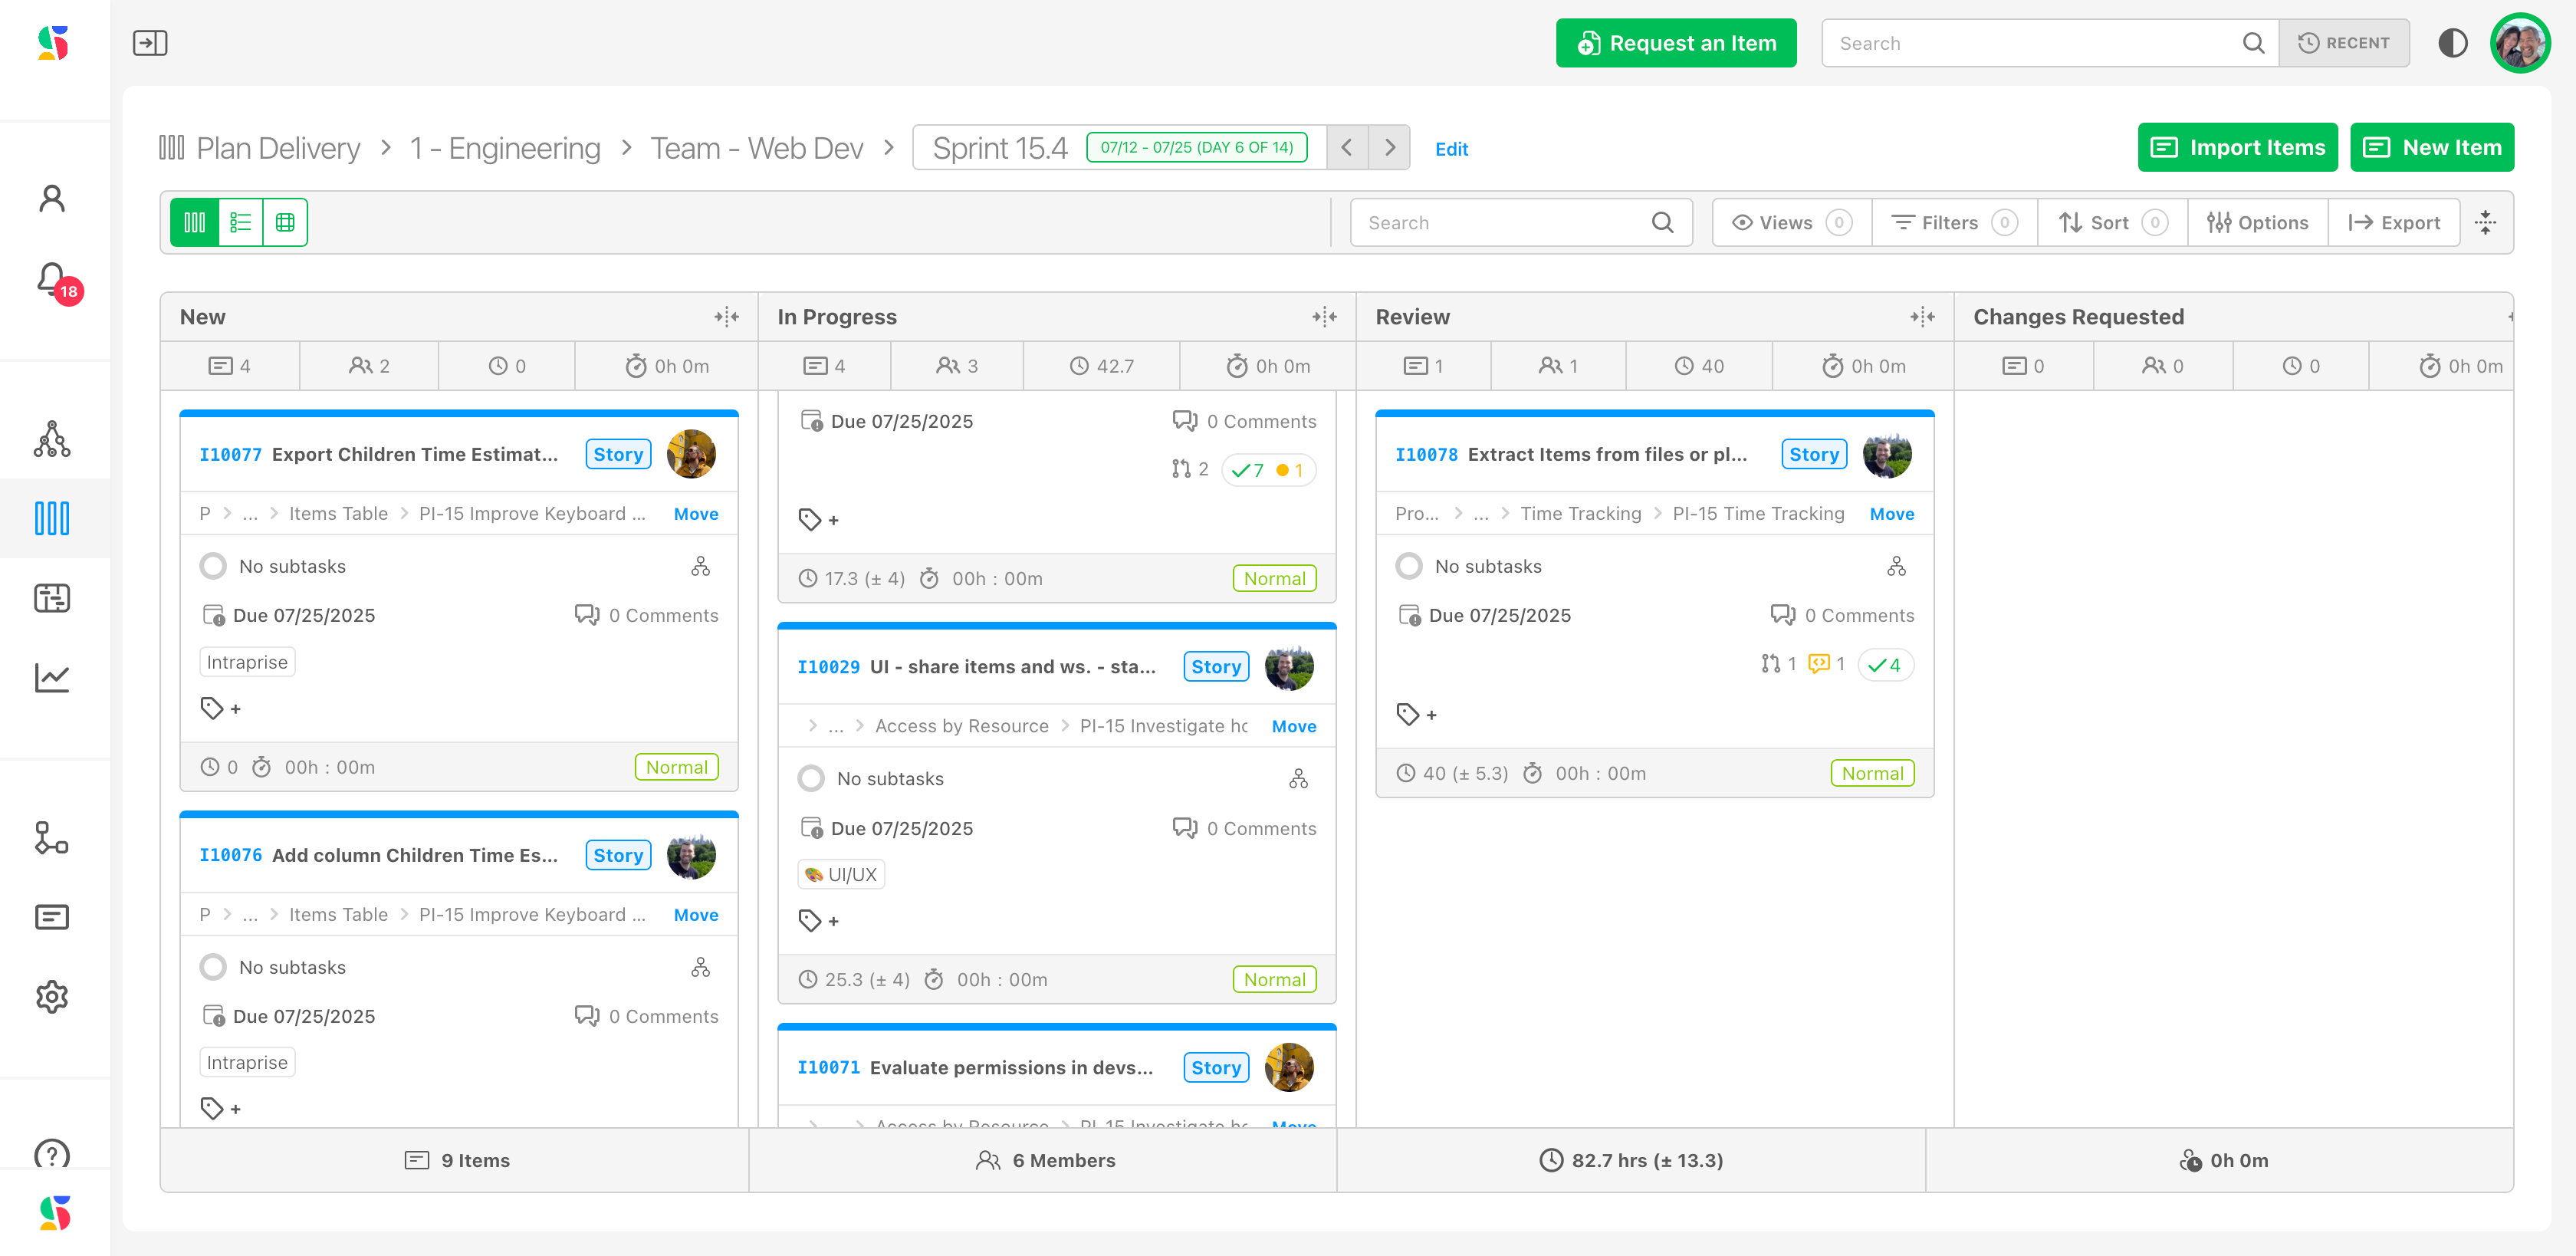
When items are added to the board, they reflect their current status.
As work progresses, you can move backward or forward to the appropriate status by dragging the card, changing the status in the item's workspace, or by taking advantage of an automation through a trigger.
Changing status elsewhere in DevStide, e.g., inside an item's workspace, from Manage Items, Track Progress (gantt), etc., also moves the card to the appropriate status on the board.
See the example board in the image below.
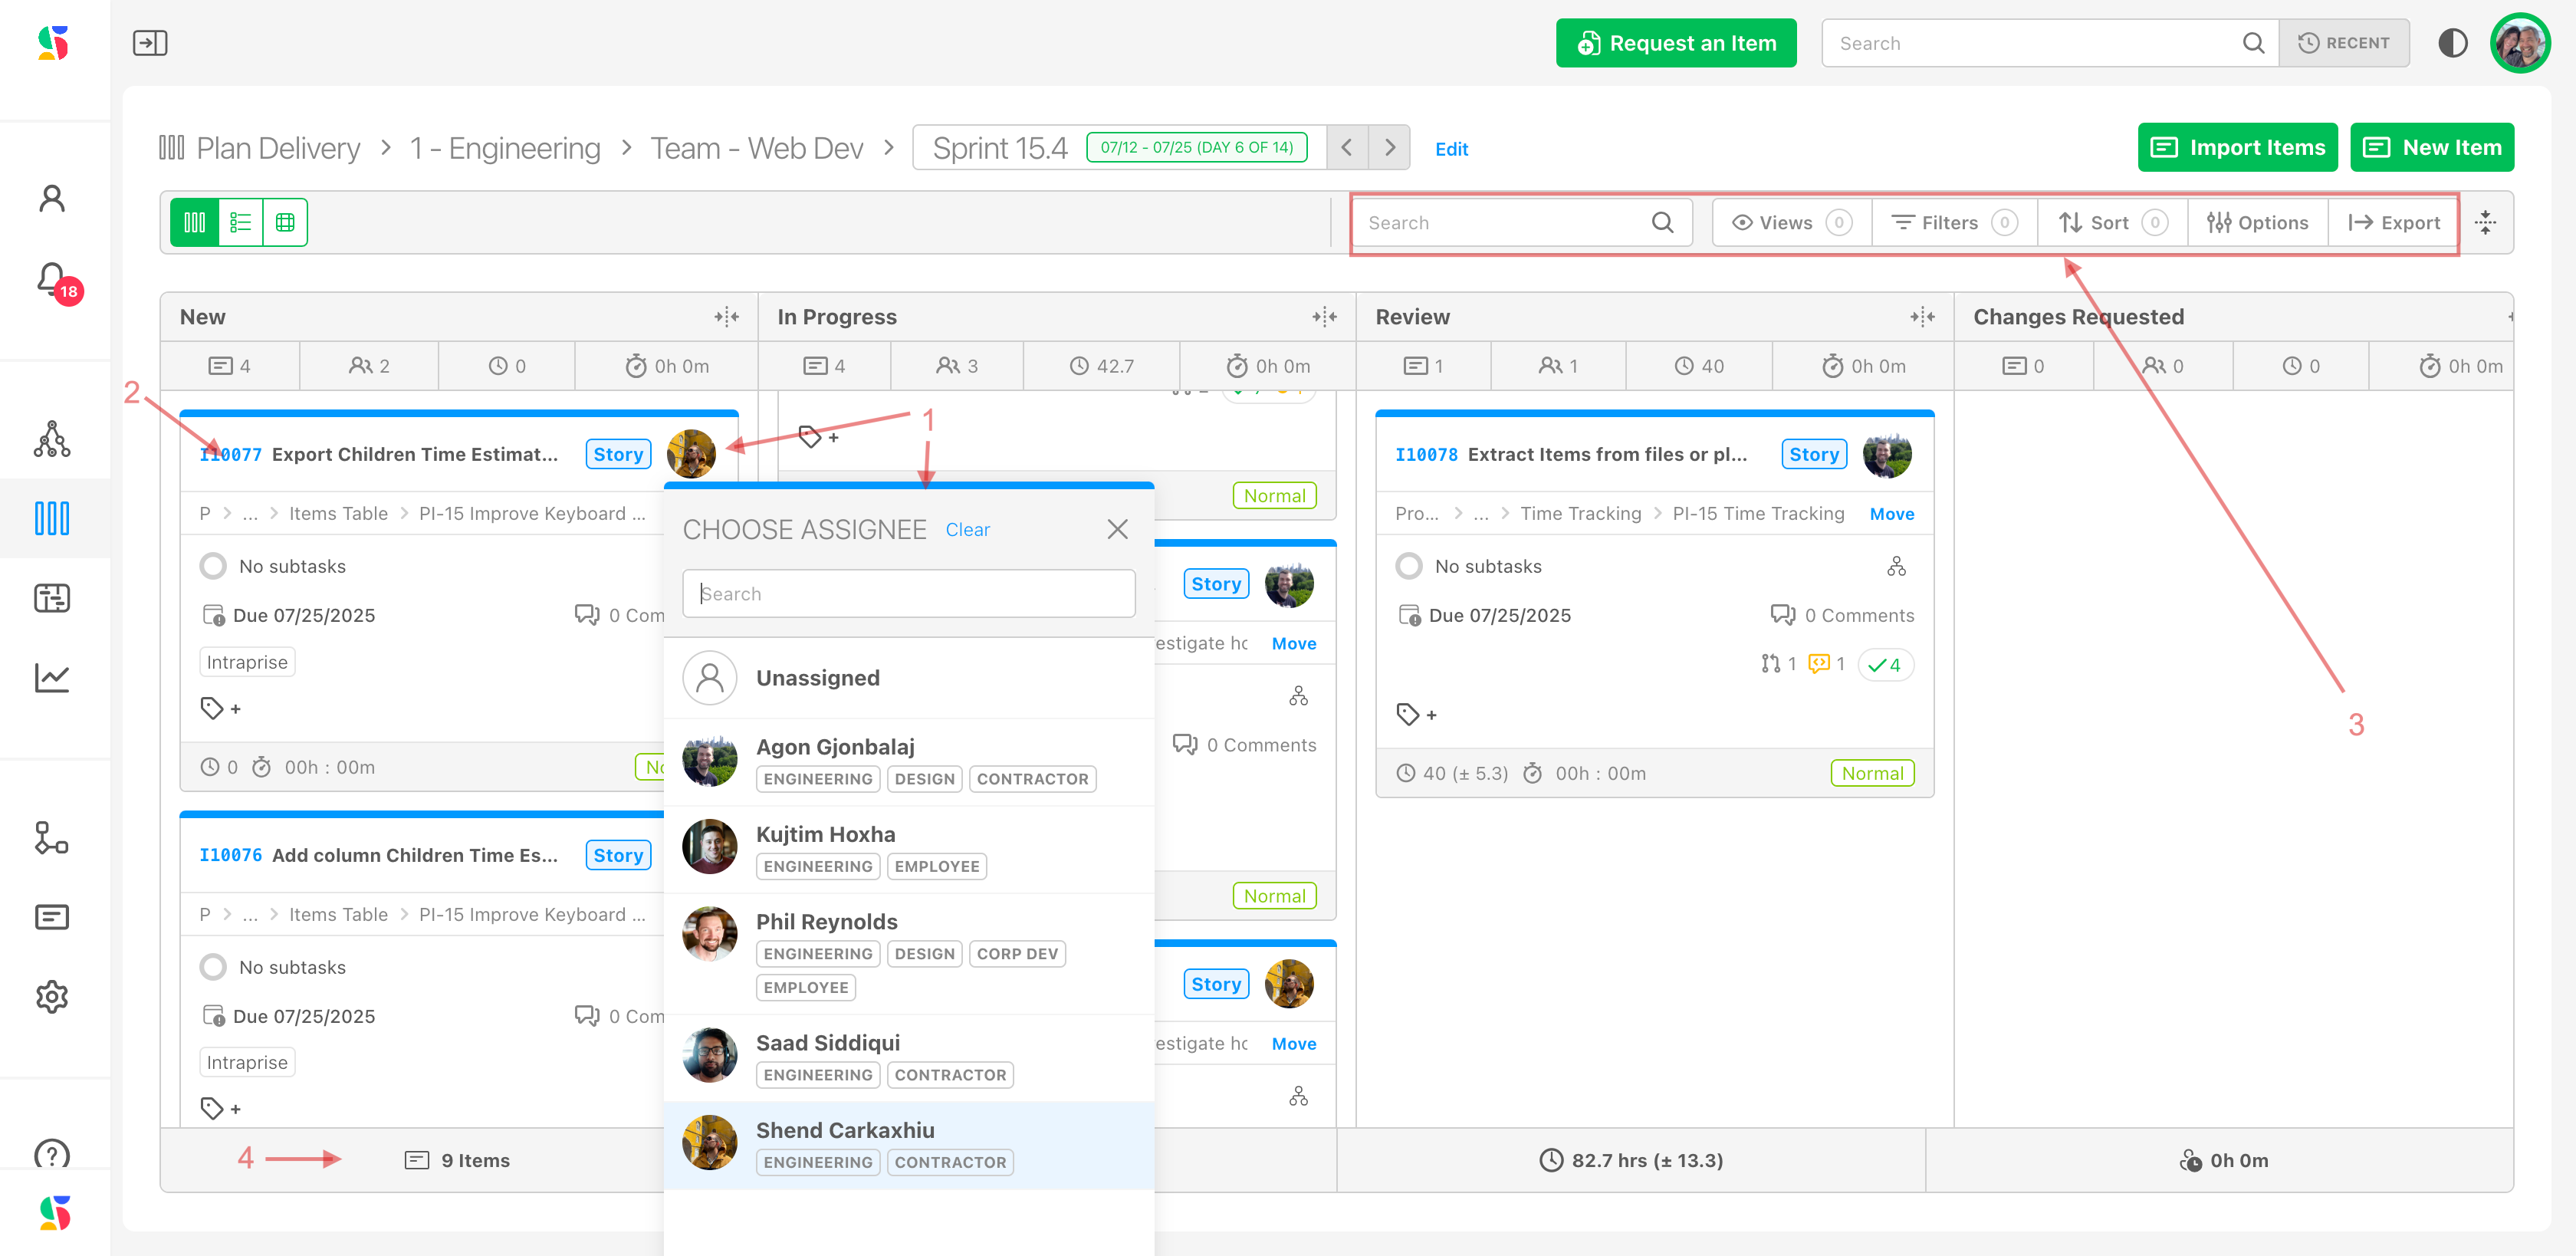
All board views are interactive and editable. You can update items directly in this view, including dragging them to their appropriate status, assigning/reassigning resources (1) and opening item drawers (2).
Using options from the control ribbon (3), you can:
- Search for specific items
- Create and open customized views for quick reference an to share with others as desired. Includes sharing setting options.
- Filter items (by cadence, status, team, etc.) to focus on specific work.
- Sort
- Hide fields
- Export
Summary data by board (4) displays along the bottom of the screen, including:
- Number of items
- Team members
- Estimated hours
- Actual hours
Adjust board real estate with by resizing (1) or collapsing (2) columns as desired. Note that both normal columns (3) and collapsed columns (4) still both display the same summary data as listed above, by stage.
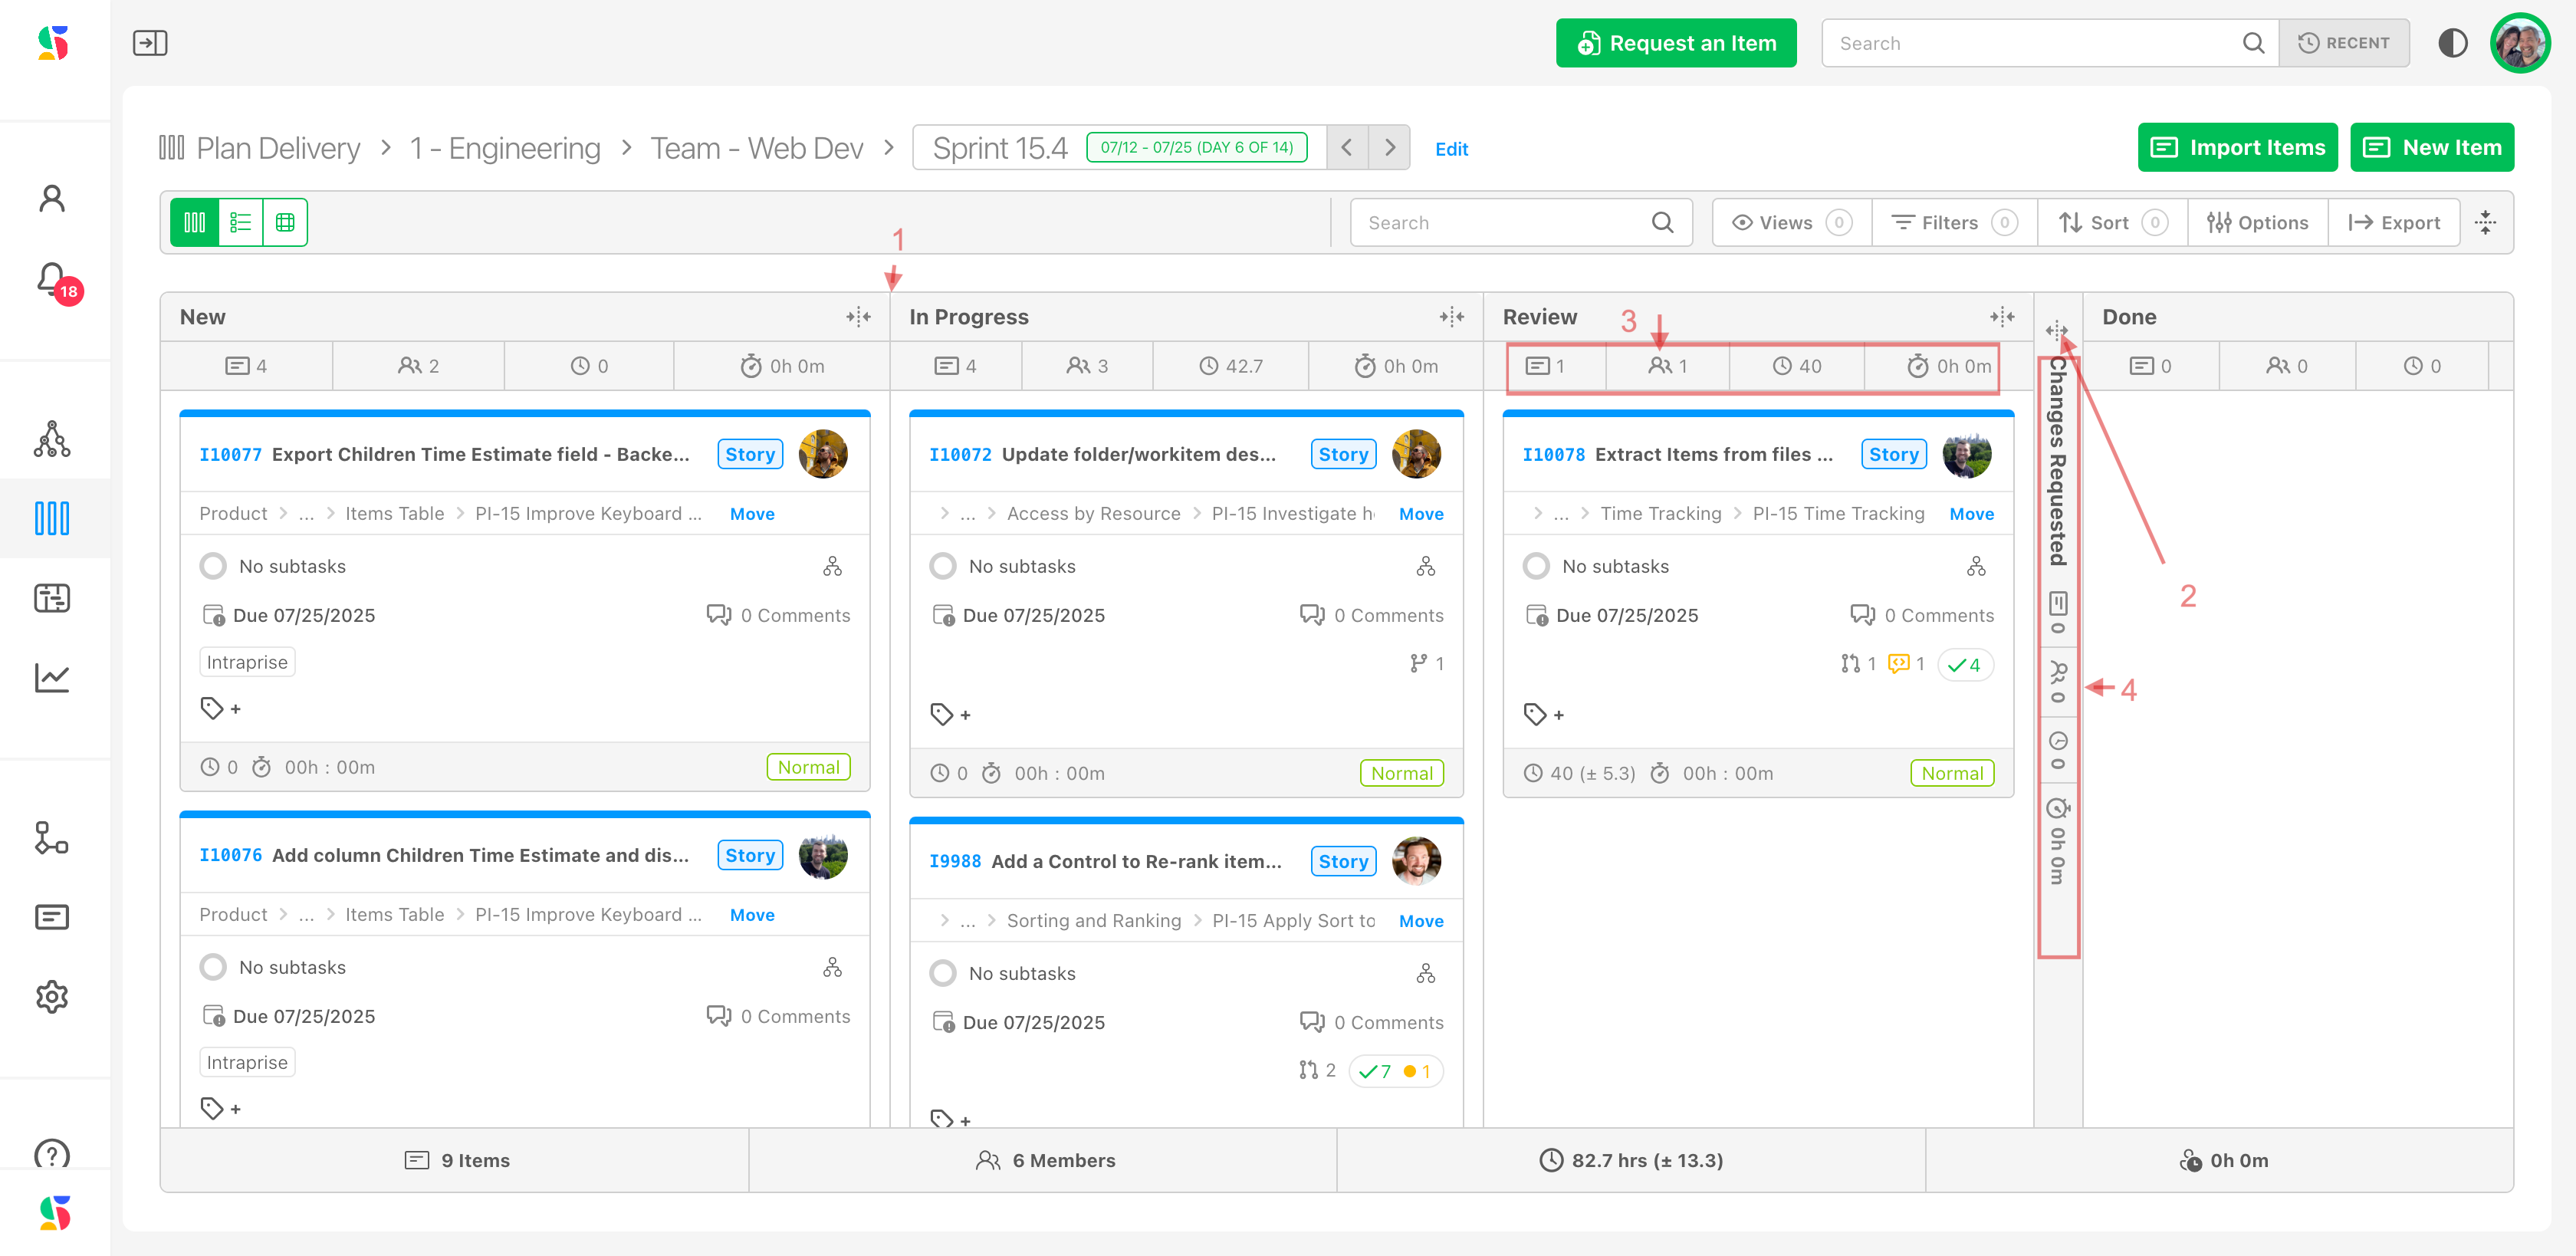
Table View
The table view in Plan Delivery is a powerful place to view work items in a spreadsheet type interface. With its customizable columns and rich data, this view allows you to commit and modify work items easily, while also being able to sort, filter, and prioritize items.
Many teams find this view extremely useful for review meetings, client conversations, program increment planning and stand-up meetings.
You can export the data from here to share more broadly or create customized internal or external views.
To access this view, click open a board and then click on the table view icon (1) on the left side of the control ribbon. Here's what this view looks like. Highlights include:
- Width adjustable and sortable columns (2)
- Search, customizable/Saved views, filters, column display options and exporting (3)
- Board statistics, including item numbers, members, estimated and completed time (4)
- Ability to add items to the board by importing or adding items from the screen (5)
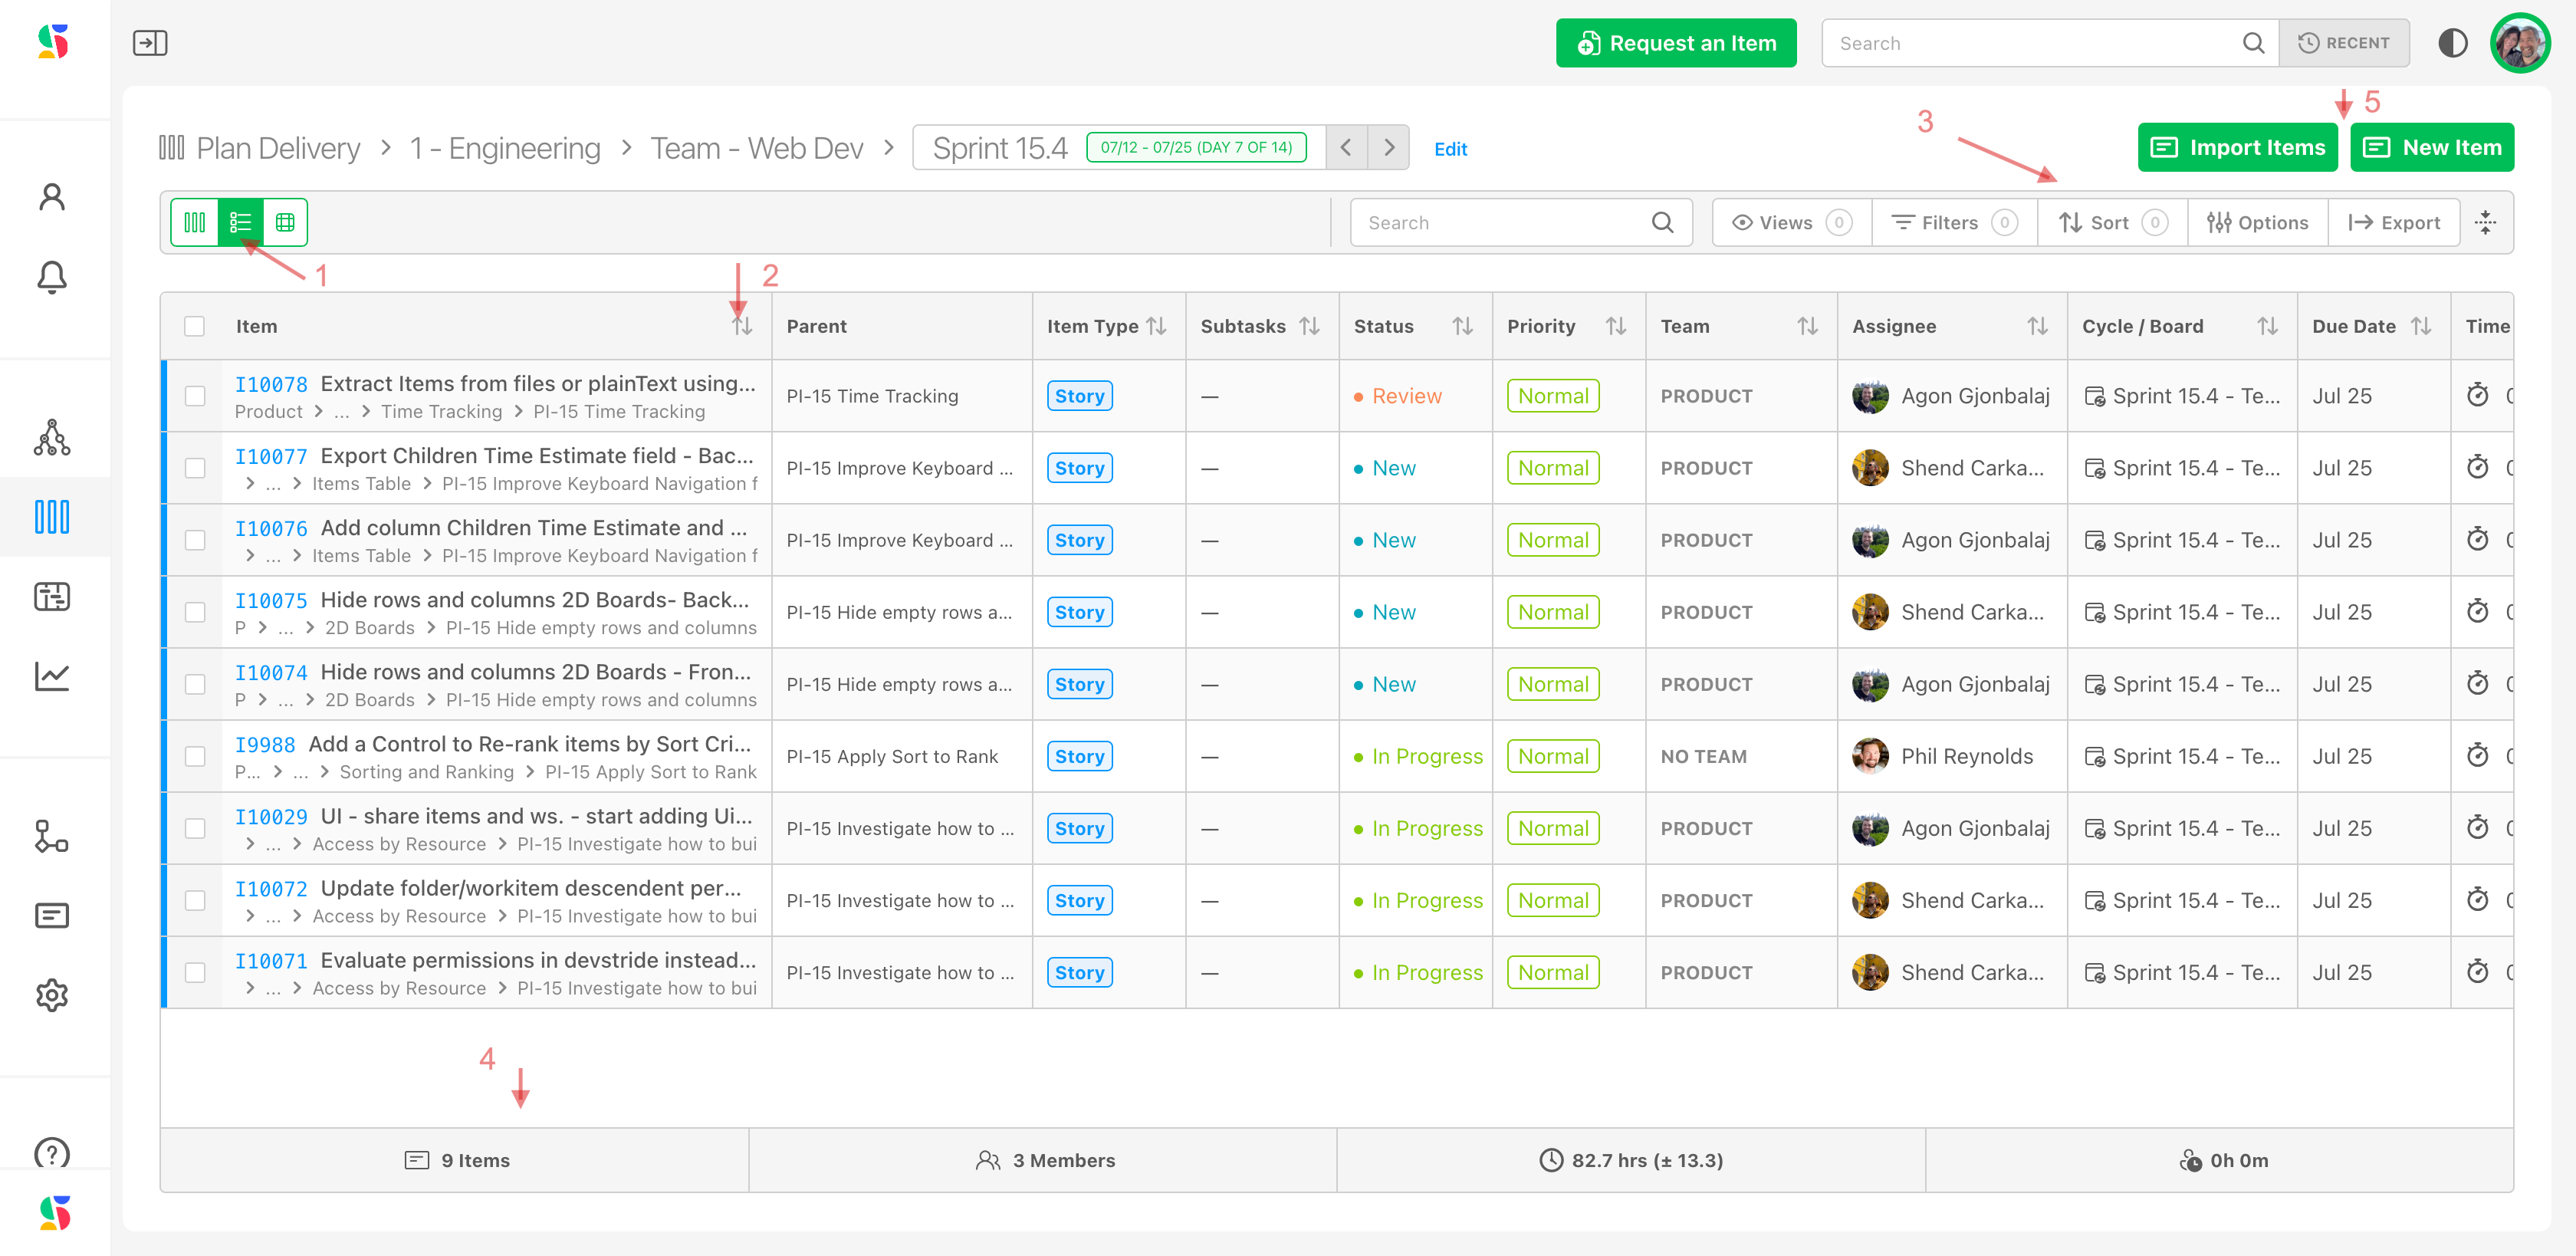
As a fully interactive and editable view, the board also provides hot keys and drop down lists allow users to move through the items, review, and make changes with ease.
2D View
DevStride's 2D of boards offers a visual picture to see the status work by team and across all teams tied to a given board.
It provides a rich, interactive, and editable graphic interface with many options, including:
- Ability to view different data points on either the x or y axis, including by:
- Assignee
- Color of items
- Engineering type (i.e., backend, none, UI/UX, research, review)
- Item type (read only)
- Parent (read only)
- Priority
- Release
- Status
You can click on the axis switch icon from the control ribbon (located between the Row and Column selectors) to designate what displays on each axis.
What's more, the 2D view allows users to see external dependencies. The video below shows external dependencies from other boards listed in the bottom row.
This "gutter lane" helps connect the work in a visible way. For additional visibilty, you can turn on the dependency graph mode, which will display the relationships in a spider graph:
Advanced Board Features and capabilities
Other advanced board features include:
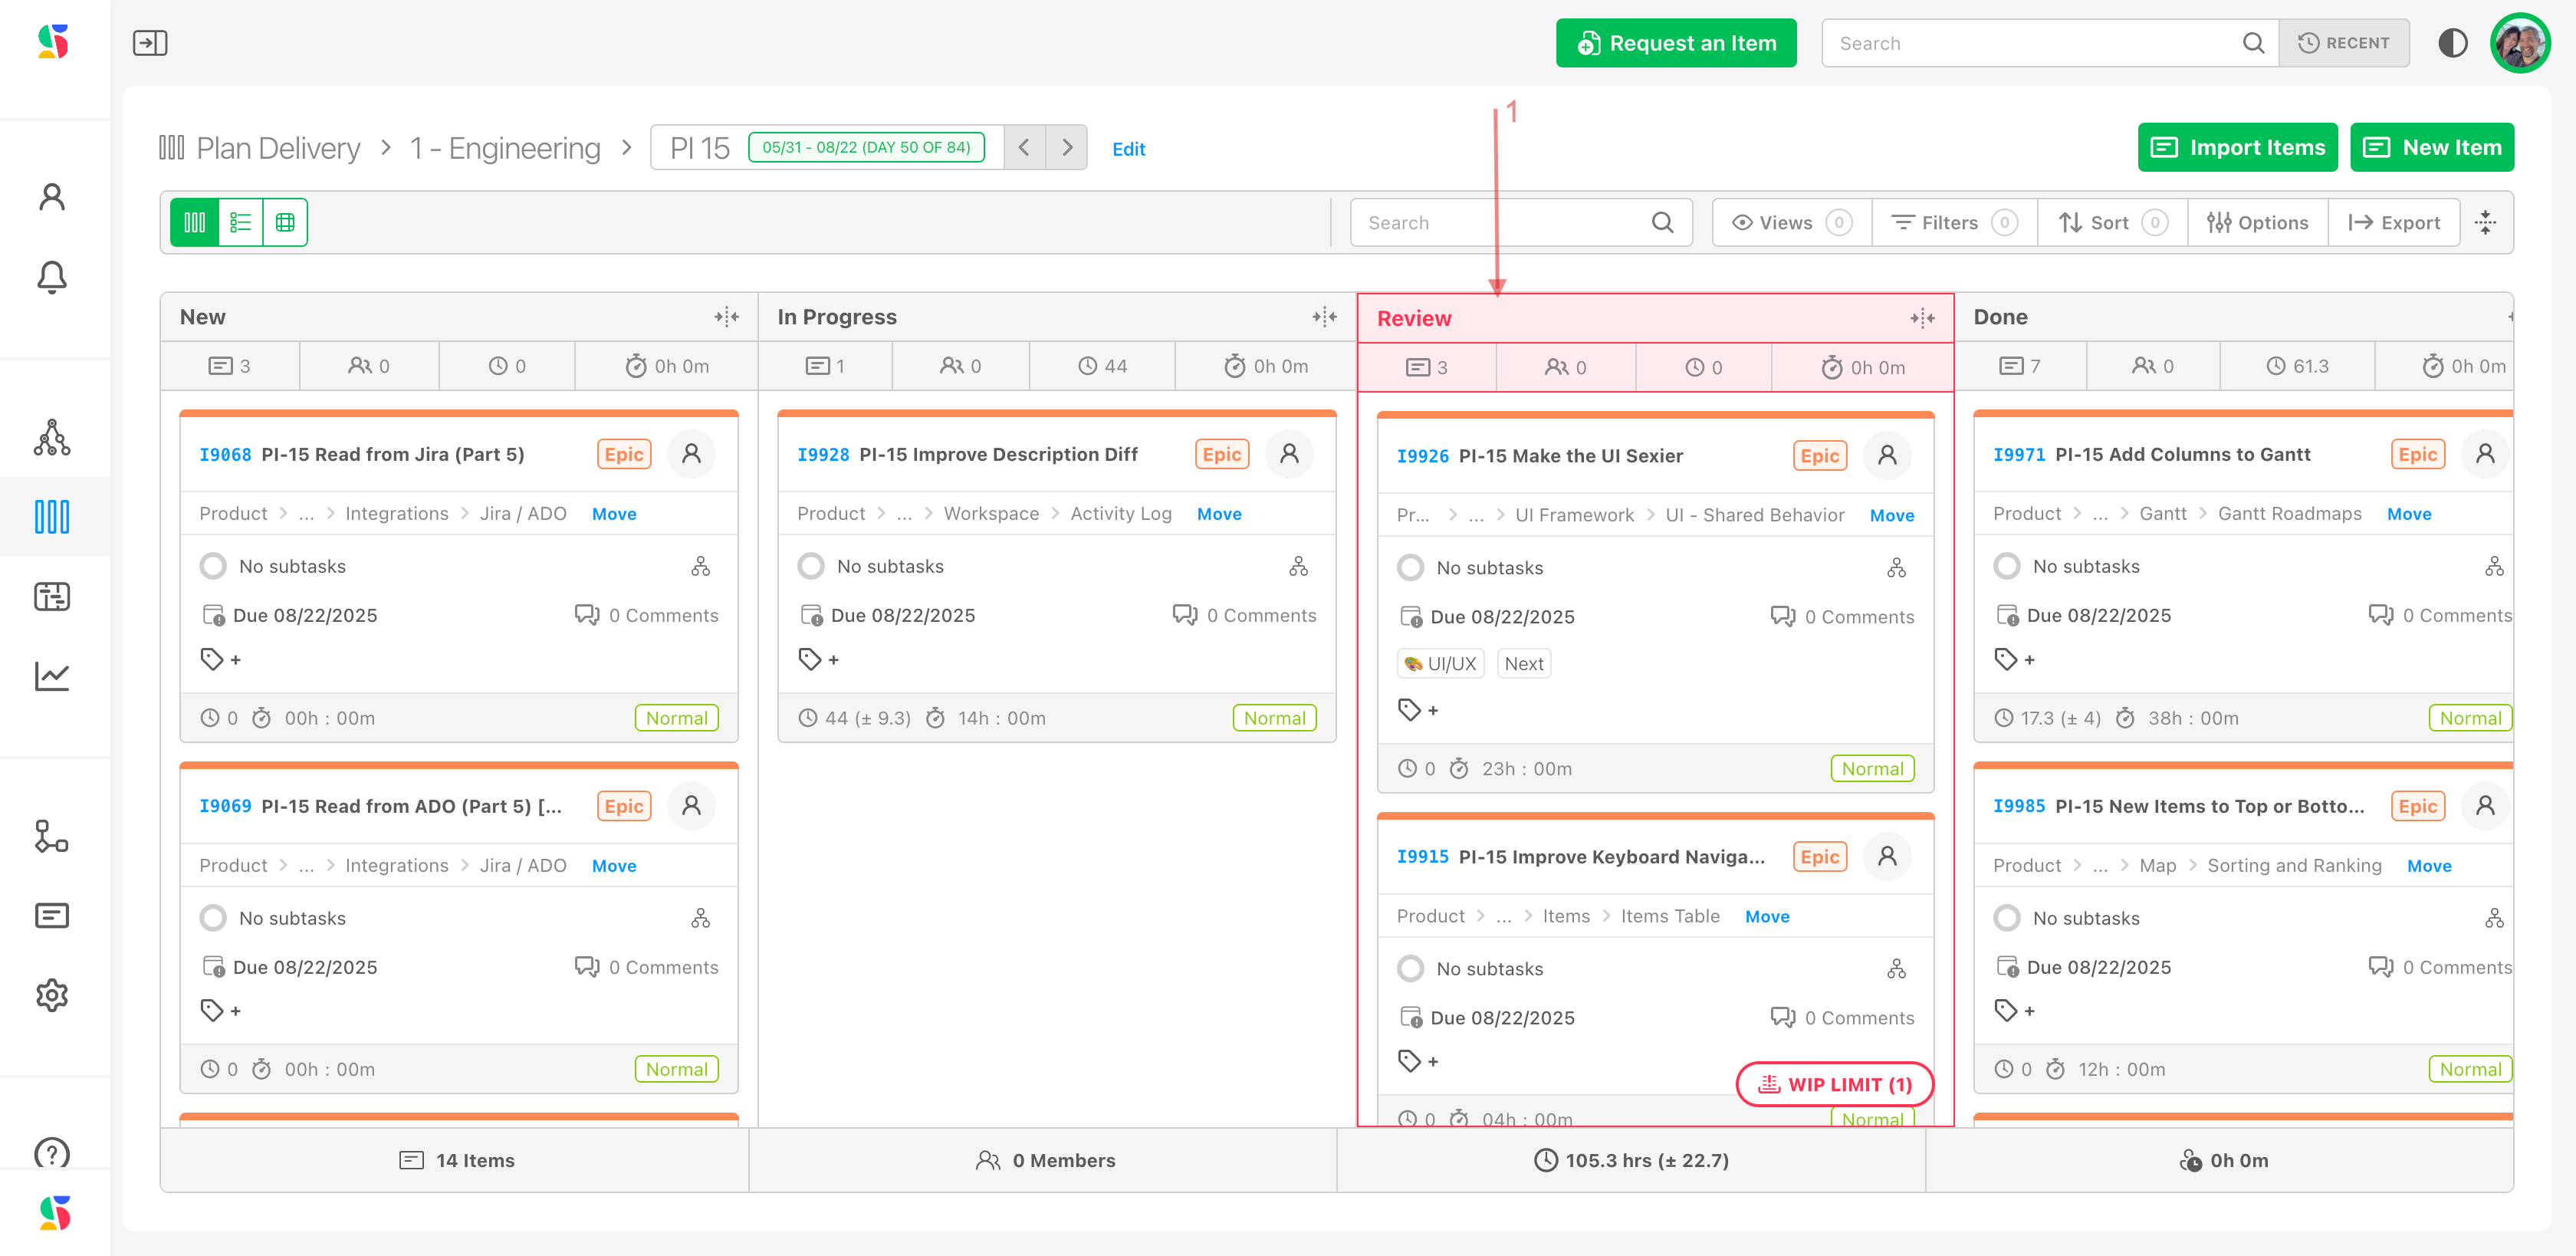
- Work-in-Progress (WIP) limits to avoid overload. If you use WIP limiters, boards give you a warning when WIP limits are exceeded. This feature helps teams to manage capacity and prevent bottlenecks.
In the example below, the review column has turned read because the rule set by the admin in Settings - Statuses & WIP Limiters has been exceeded.
- Automatic parent rollup: moving a task in the boards triggers status updates and completion totals for its parents.
Why this matters:
Boards give everyone—from individual contributors to executives—clear visibility into who’s doing what, and what’s getting done. They keep day-to-day work connected to strategic goals.
Controlled Views can be shared with Clients,
Using cycle boards ensures that every team receives and manages their portion of the work, while still being connected to overall delivery objectives and timing.
DevStride's cadence and board capabilities offer a powerful way to manage structured workflows, ensuring consistent execution, visibility, and collaboration.
By properly configuring and using these features, organizations can drive predictable and scalable project success.
Was this article helpful?