Setting up and Using Perpetual Boards
- 16 Jul 2025
- 6 Minutes to read
- Contributors

- Print
- DarkLight
Setting up and Using Perpetual Boards
- Updated on 16 Jul 2025
- 6 Minutes to read
- Contributors
- Print
- DarkLight
Article summary
Did you find this summary helpful?
Thank you for your feedback!
What it is
Perpetual Boards (also called evergreen boards) are ideal for workflows that don’t follow a strict sprint or time-boxed cycle.
These boards are always active and display work as it flows through your process without specific start or end dates. Due dates on items can still be used - there is just no strict start and stop timing for the board.
Examples of use case for perpetual boards is for an ongoing queue of work such as:
- a trouble ticket list
- a backlog
- operational to-do's
Here's how to set up and use a perpetual board:
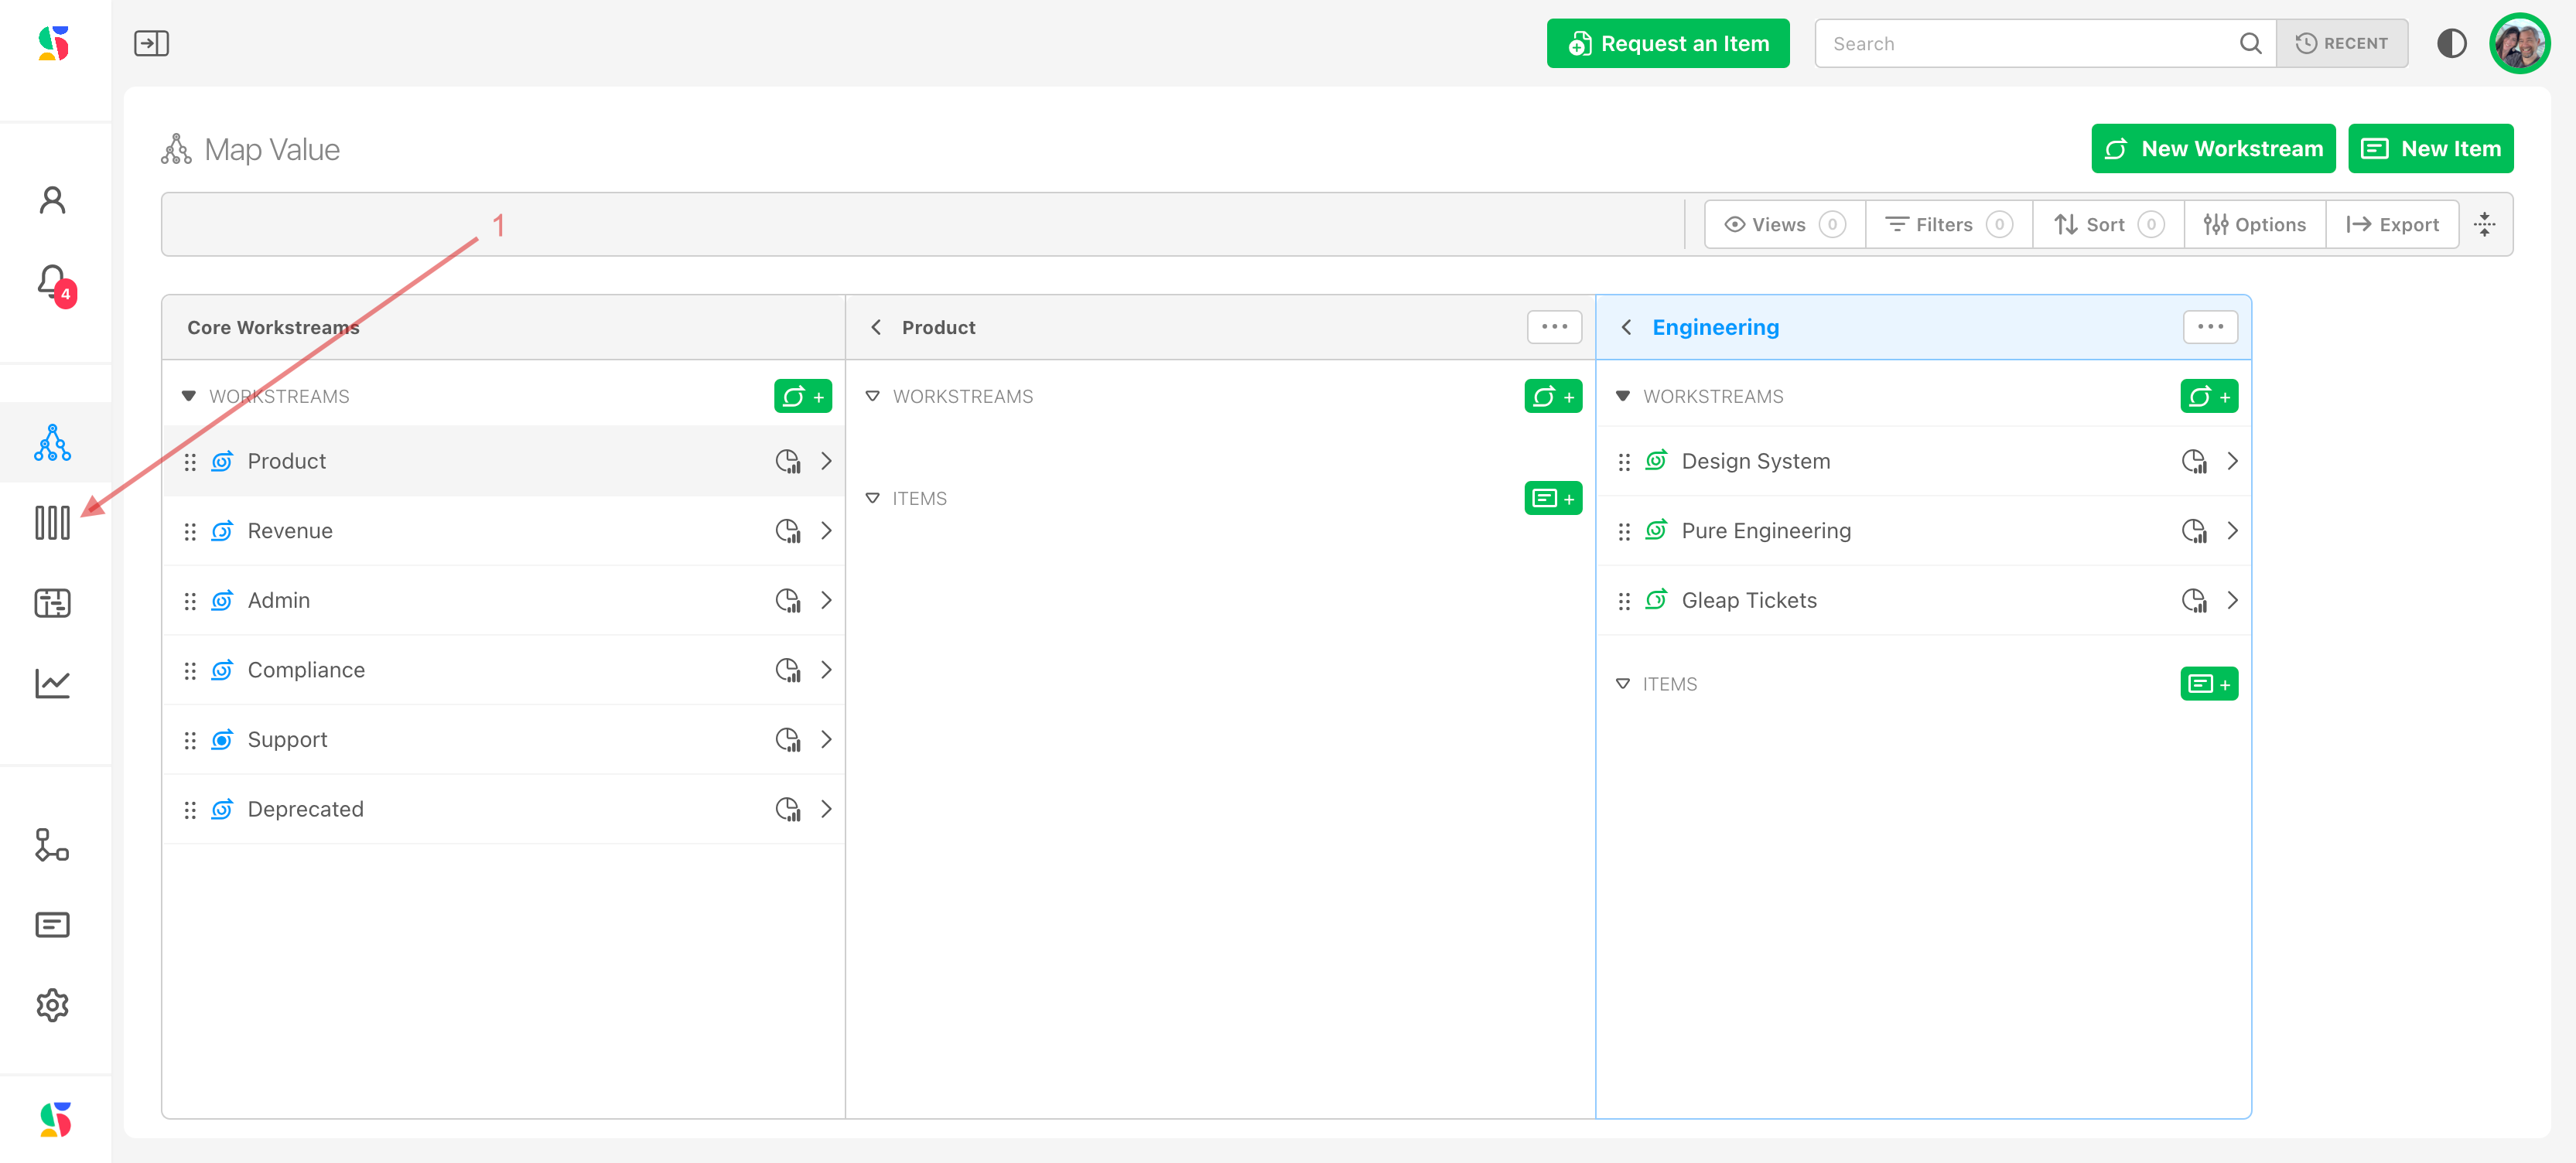
Step 1: Navigate to Boards
Click the “Plan Delivery” icon (1).
Step 2: Select or Create your working teams folder.
Navigate to the working teams folder for which you want to add a board (2a).
Or create a new folder at this time.
Click the “+ New” button (2b)
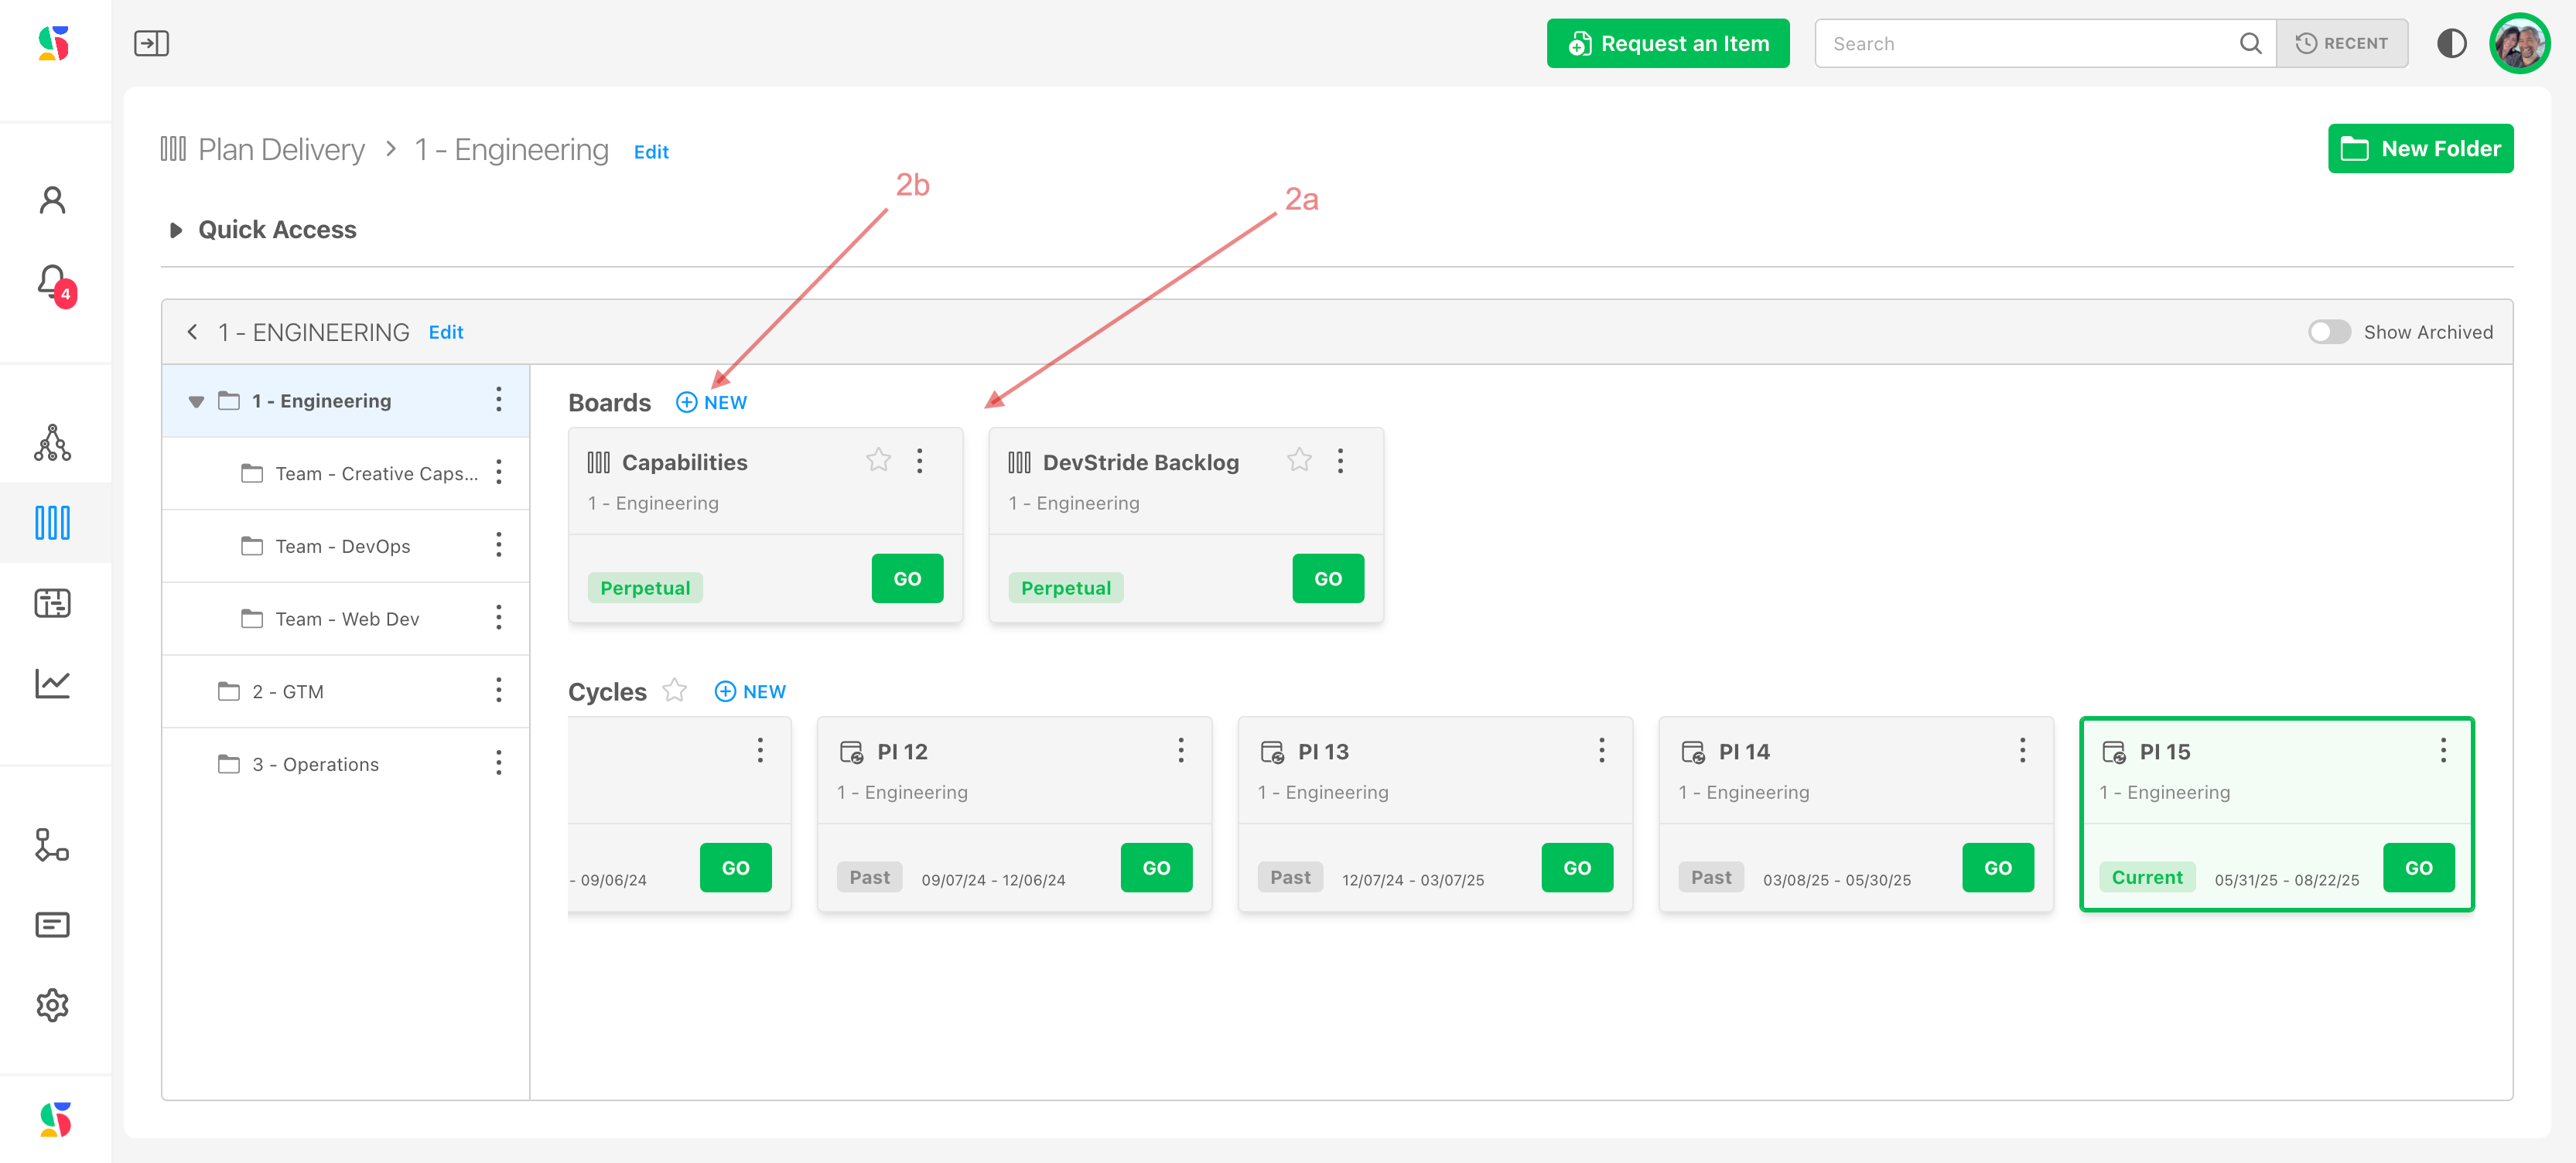
Step 3: Add a new board.
To add a new board, click the + New icon.
Step 4: Configure Basic Board Settings
In the board creation dialog:
Name your board.
Example: “Customer Support Queue” or “Marketing Content Pipeline.”Provide a description (optional)
Choose your status collection.
The status collection will drive the phases you are using to use for this board. The status collections should already have been set up when creating your Settings. But you can add a different status at this time by clicking on Manage Statuses or heading over to Settings.Select a default team (optional)
The default team is used to pre populate the team field when you create an item while viewing the board.
- Click Create Board.
The board Displays. This is just an empty board at this point. To add items, you can either:
Step 5: Add items to your board.
- Create items here on this screen by:
- Clicking New Item
or
- Import a set of items from the workstream
- To do this, click Import Items.
or
- Navigate to Map Value and assign to the boards from items in the workstream map.
❗ Important: To make this a perpetual board, do not assign a cadence (sprints, cycles, PIs).
That’s what makes it evergreen — it runs continuously with no time box.
Step 6: View Boards
To view a particular perpetual board, navigate to the desired board through your folders view (1).
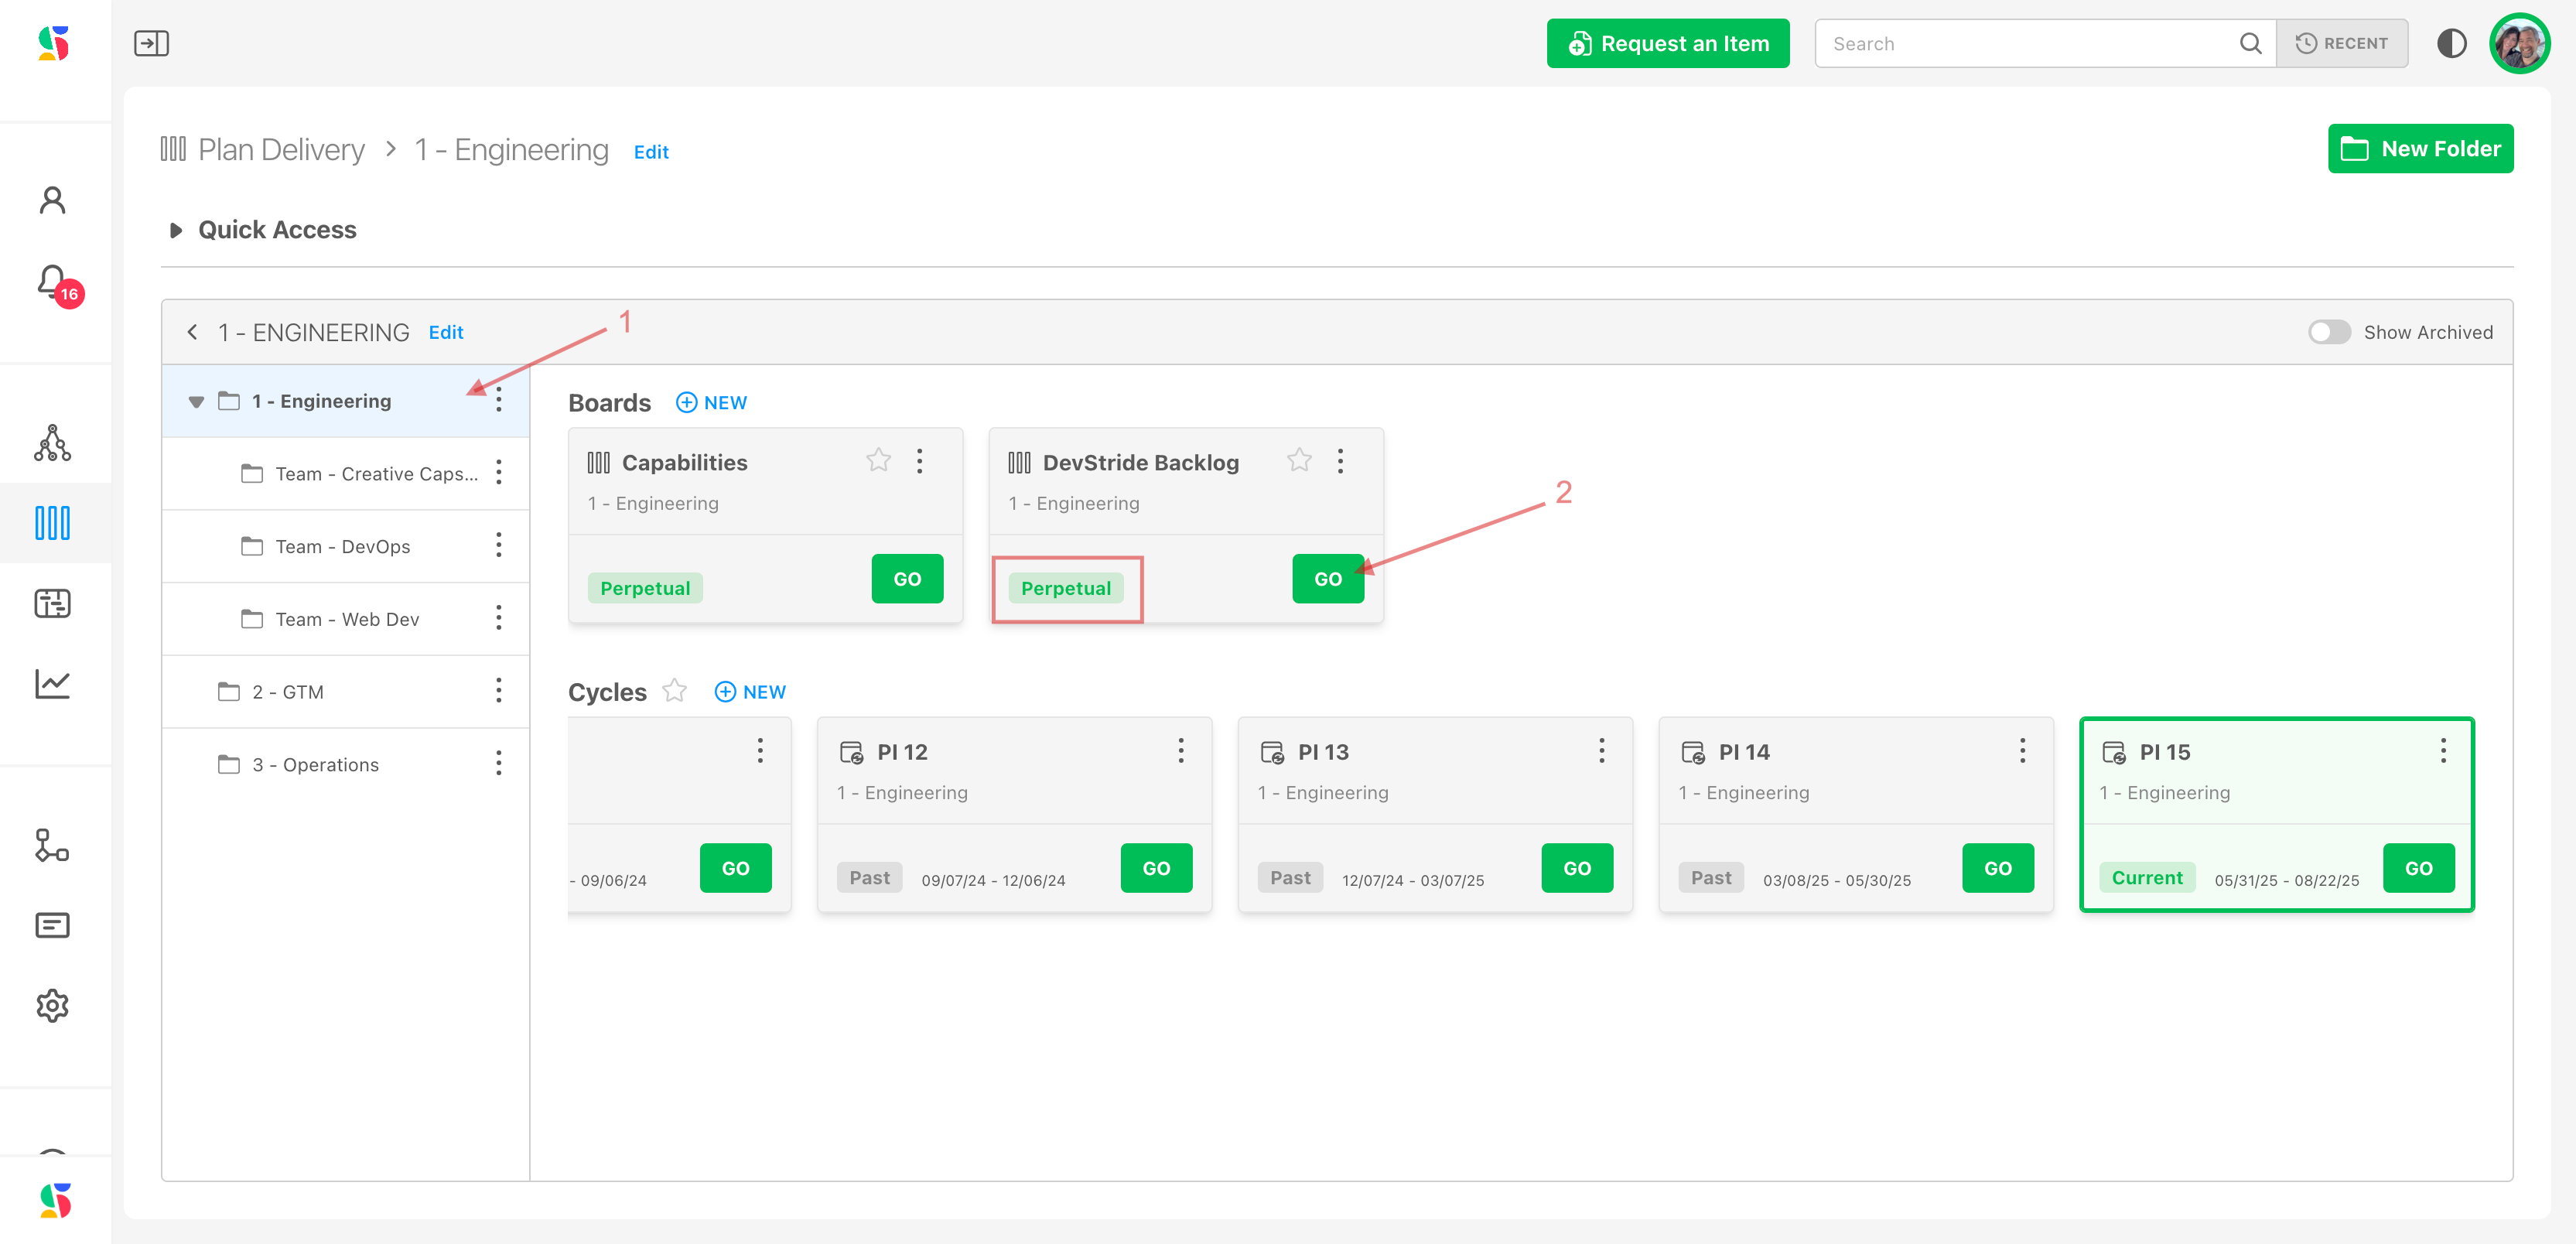
Select the board you wish to see. Perpectual boards are listed along the top. Click go on the desired board (2). Cycle based boards are listed in the next row down.
There are multiple ways to view your selected board.
Kanban view
- To view columns in a kanban board click on the kanban icon (1).
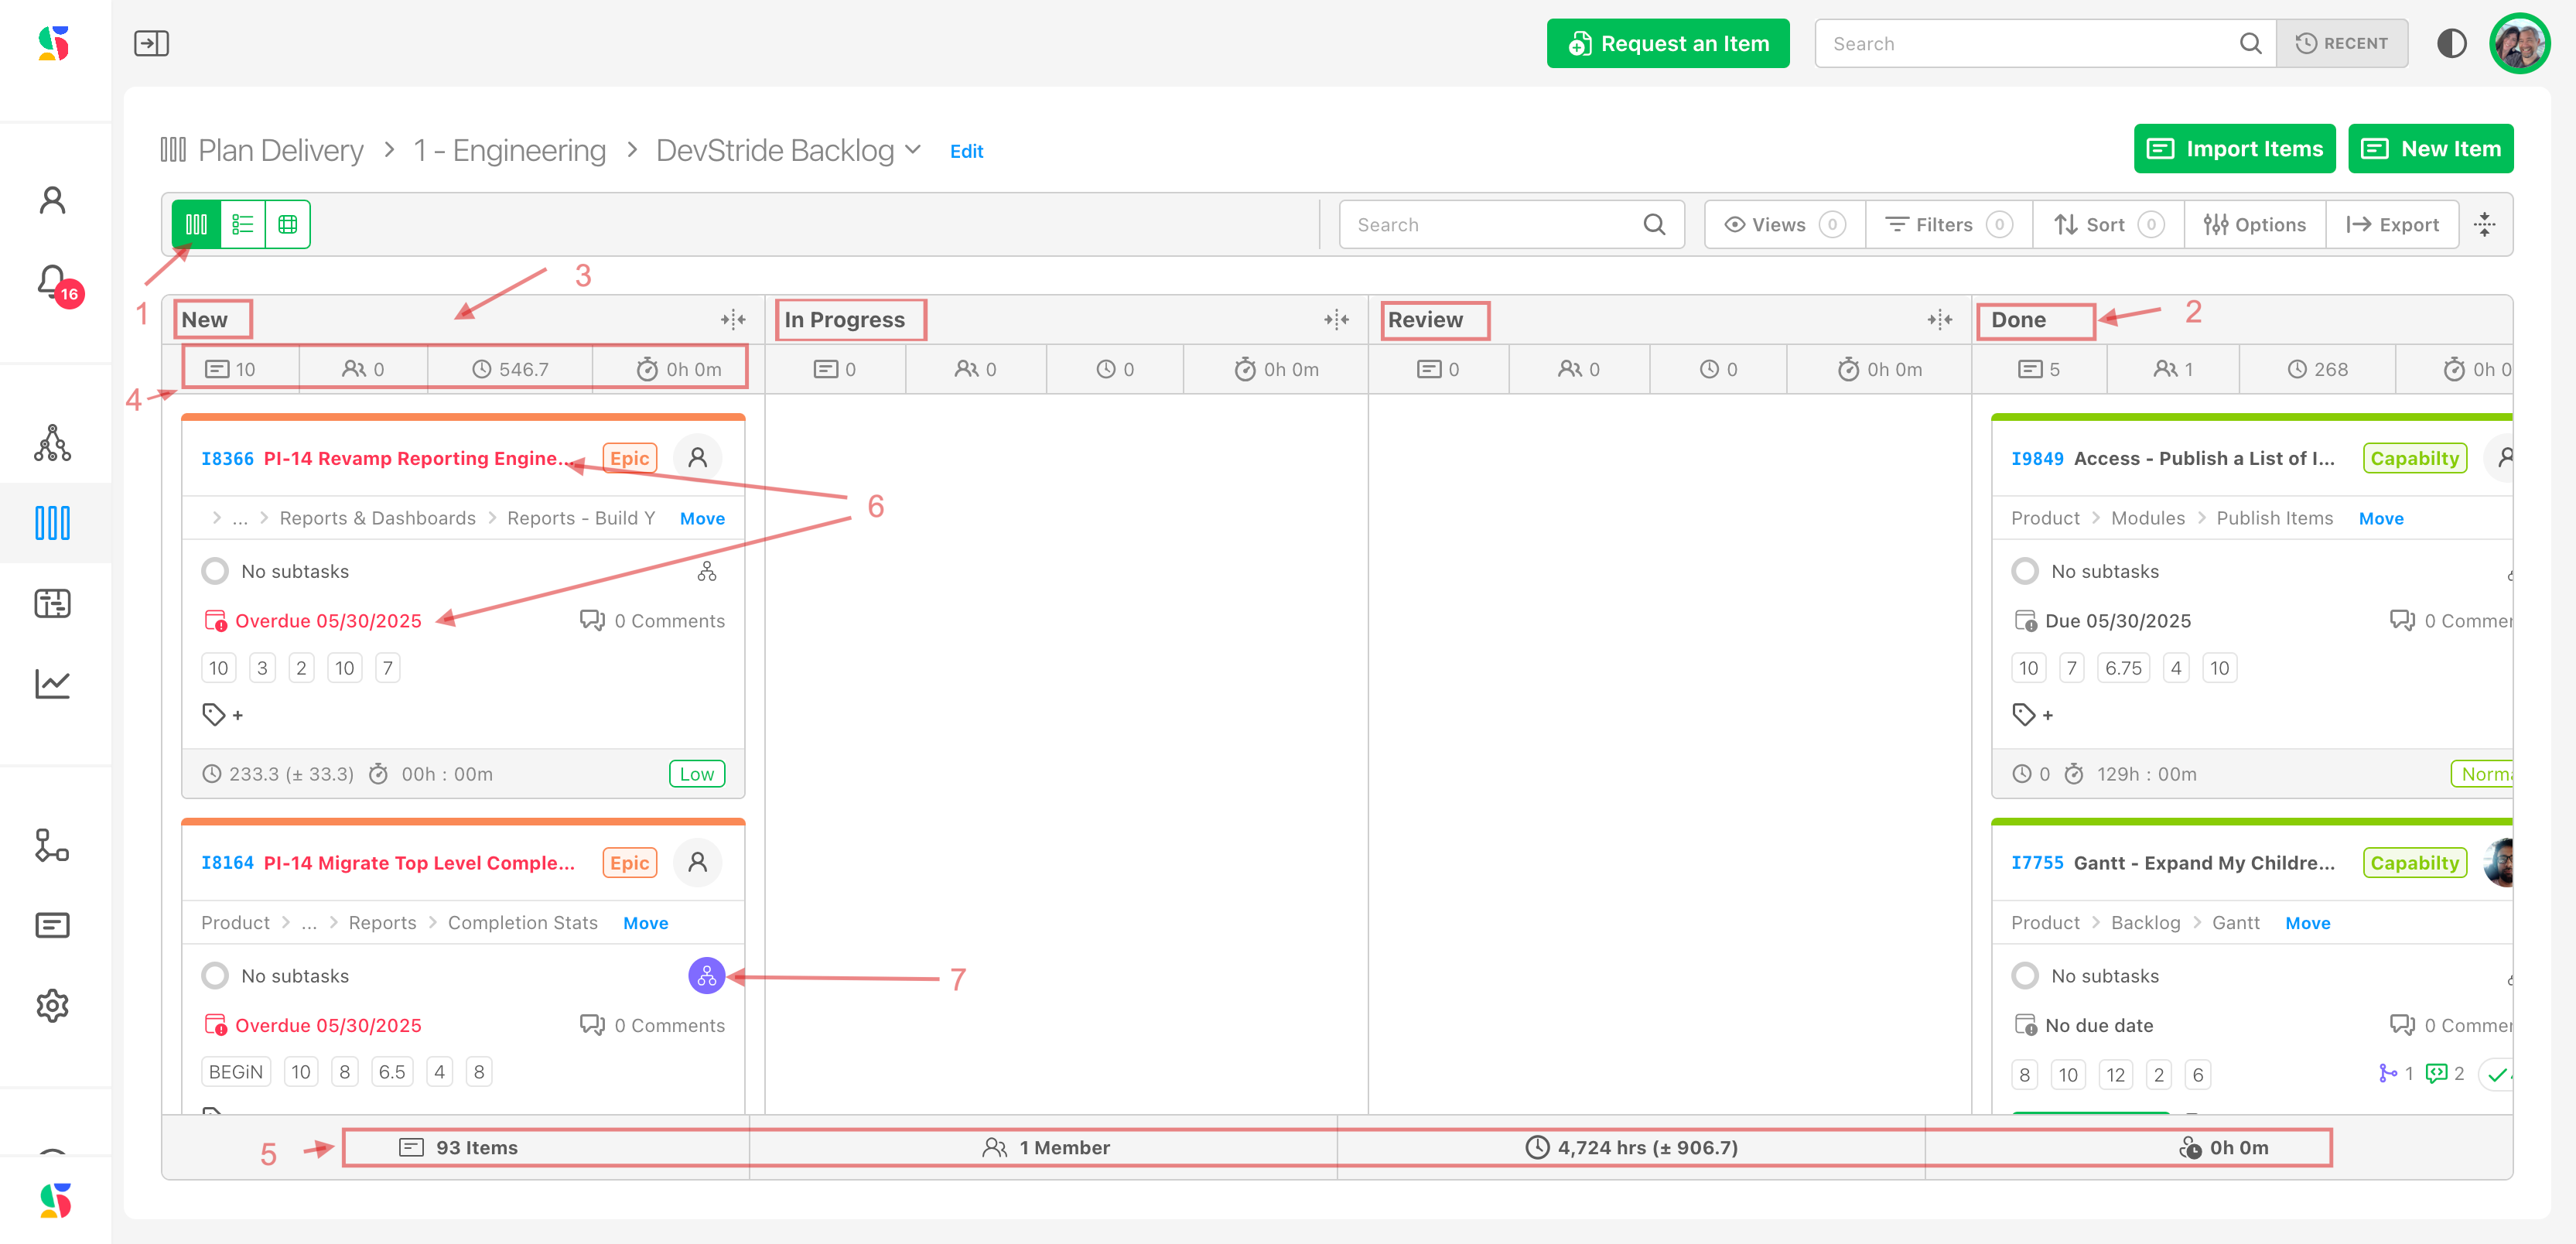
This view provides a wealth of information, including:
Items are displayed as cards in a kanban board in the column of their status (e.g., new, in progress, review, done). (2)
Reminder: Status columns are customizable in settings.
You can move items from one phase to the next by simply dragging them to the appropriate column. Items updated elsewhere in the system automatically move the cards to the correct status as well. For example, iof you mark an item as done from the Map Value, Manage items, or Track Progress modules, those changes are automatically reflected in the boards (3). You can also set up automations to move cards based on triggers.
Totals of items, teams, estimates and time spent are available at a glance by status (4).
DevStride displays overdue items in red (5).
Items with dependencies, dependents, or related to relationships display the relationship tracker icon (6).
Totals for items, team members, estimates, and time spent by board display along the bottom row (7).
Table View
To view board items in a table view, click the Table View icon (1).
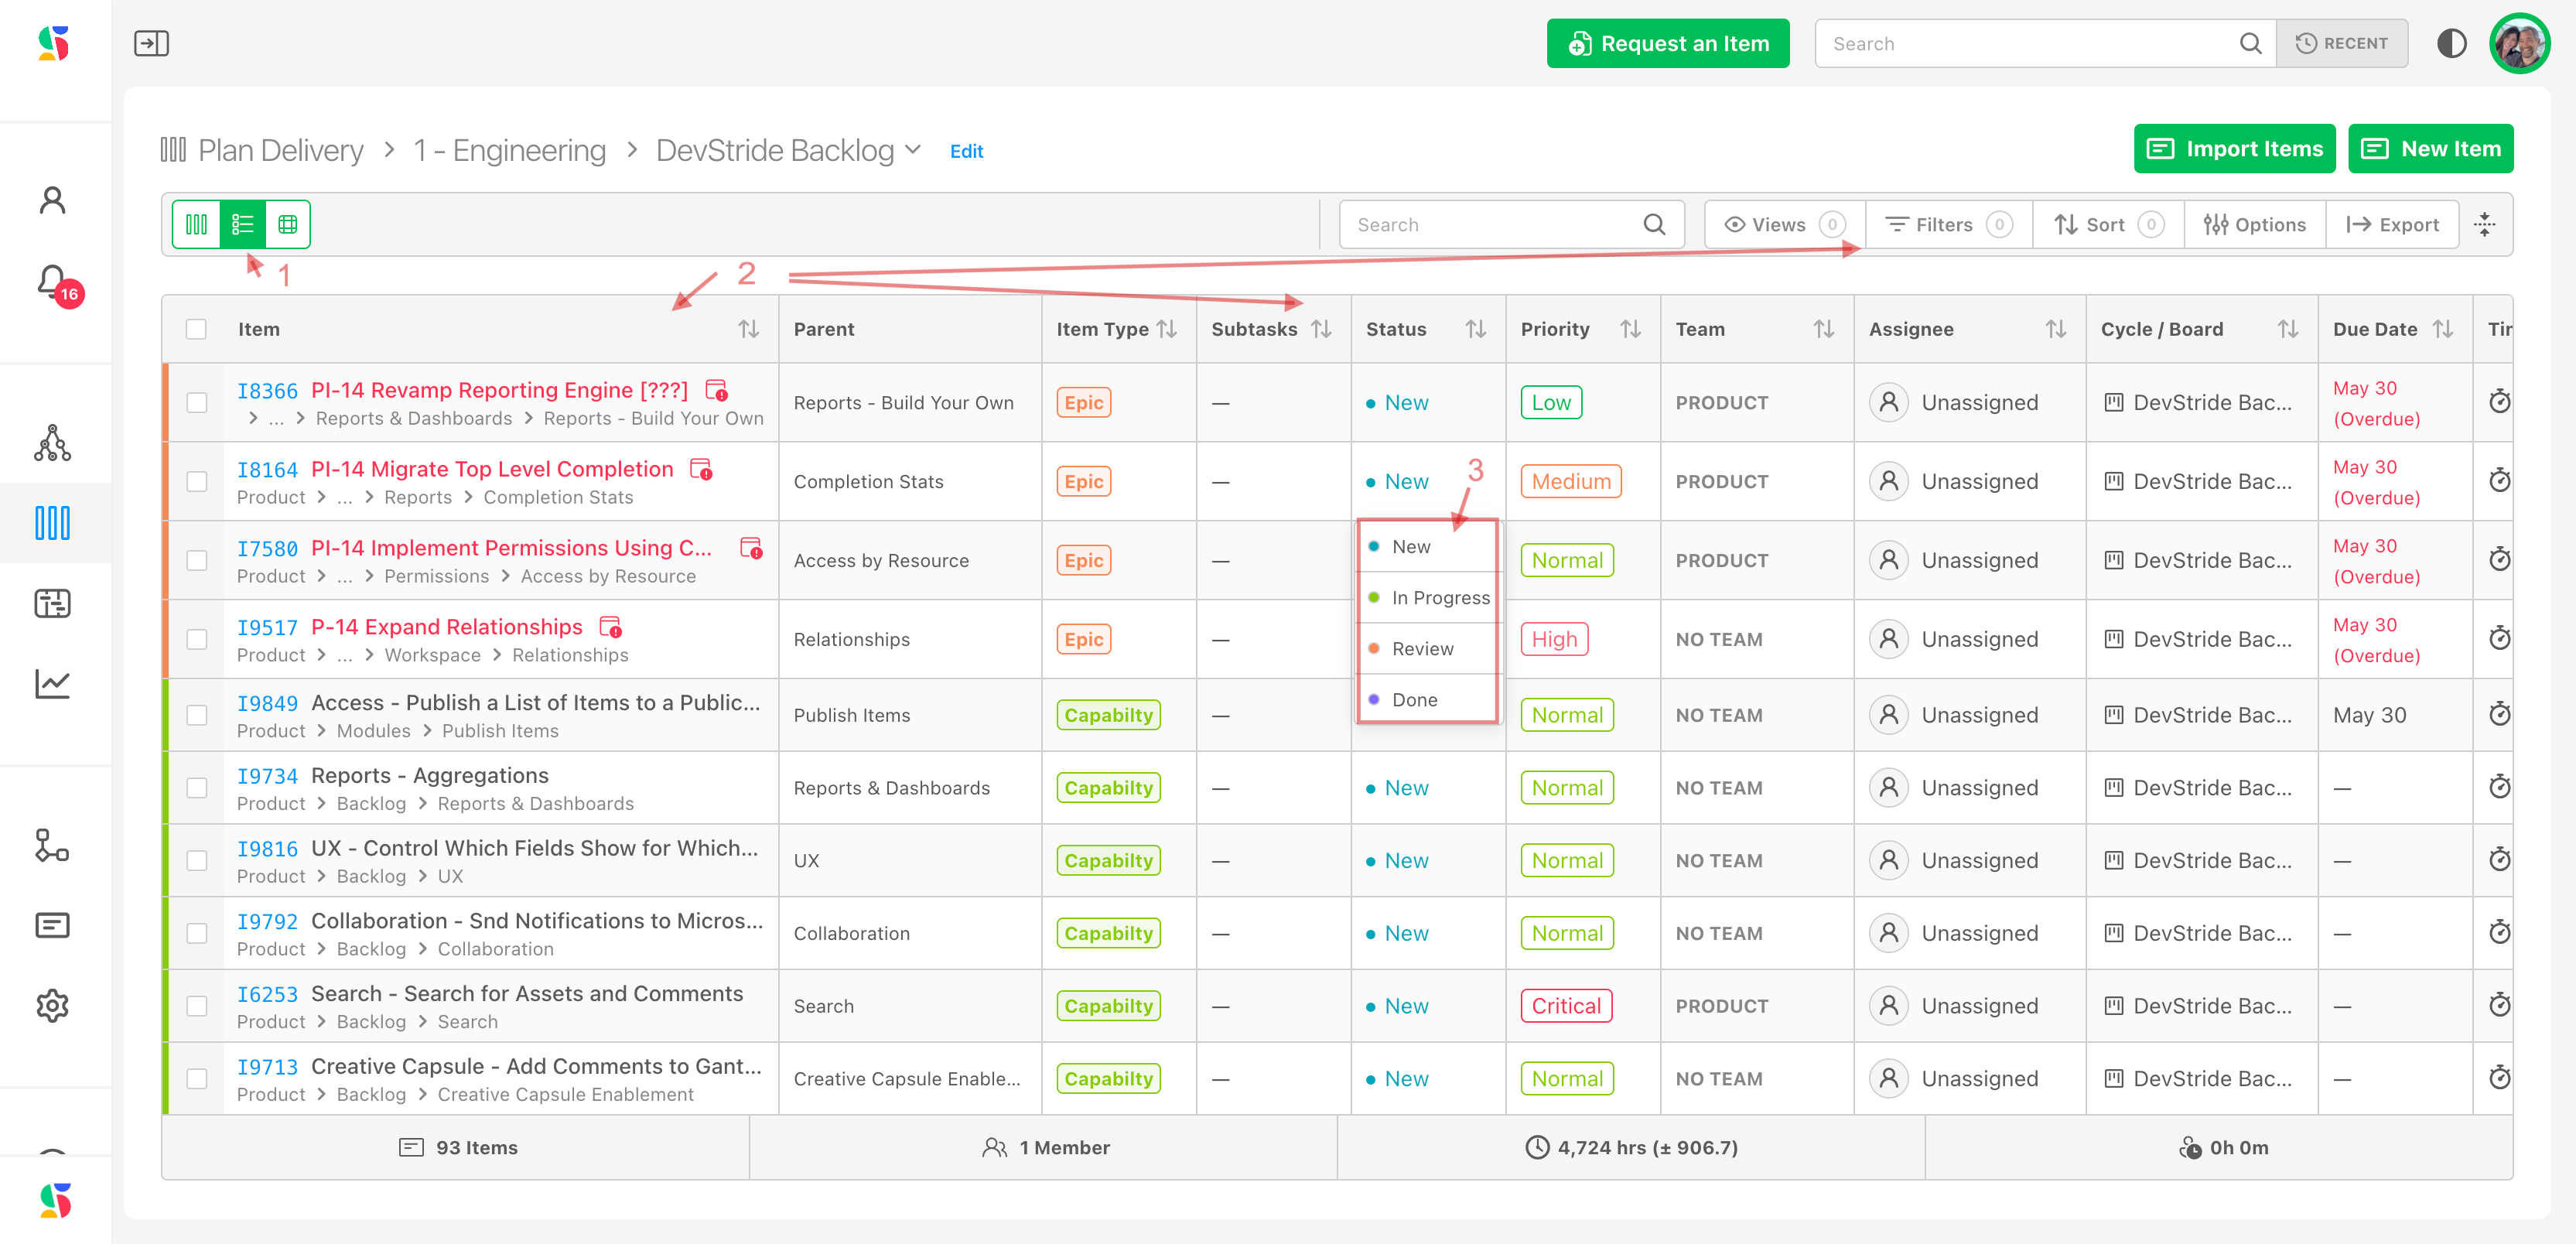
Columns are editable and rows can sorted, filtered or dragged up and down individually or as groups to reflect ranking, priority or other desired order (2).
This board shows all the items on that board in an easy to navigate, editable list. Similar to a spreadsheet, you can use your mouse, arrows, or hot keys to navigate fluidly through the rows and can edit values (3).
2D View
DevStride provides a powerful, two-dimensional view with multiple options available along the x and y axes.
To view board items in 2 D view, click on the 2D view icon (1):
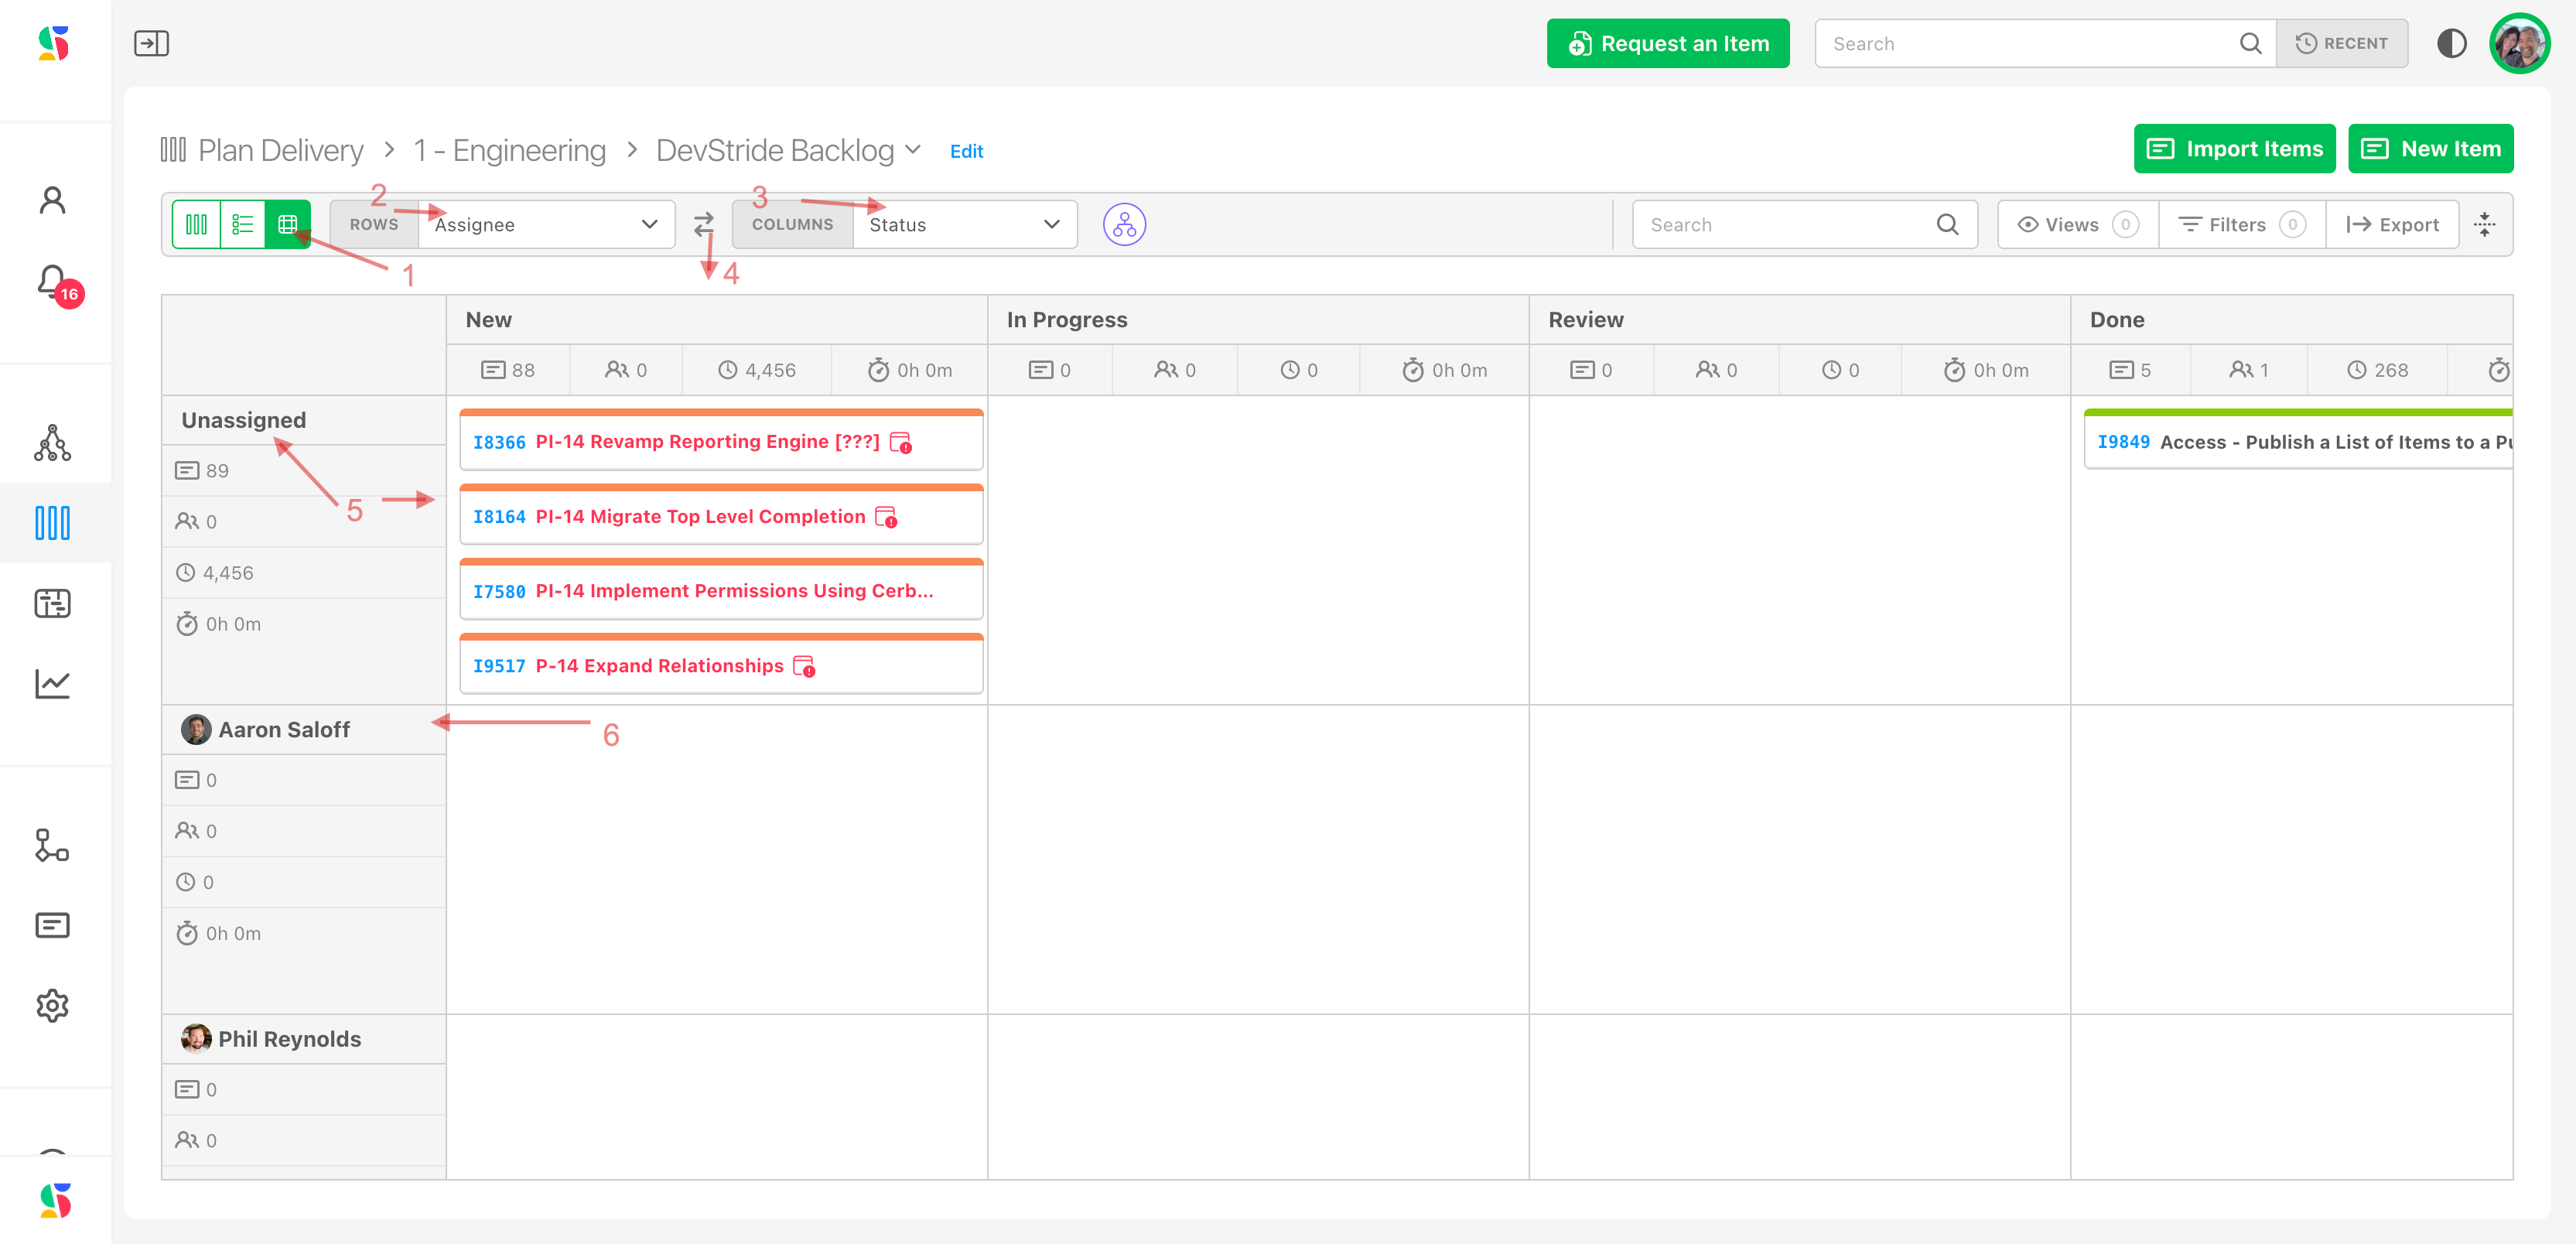
You can then select the information you would like to see in the columns. Here, we are showing assignees team in the rows (2) an Status in the columns (3).
You can change what appears on the x vs. the y axis by selecting the switch icon (4).
Unassigned tasks appear in the first row (5). You can drag tasks into different rows, thereby assigning them. You can also change the status of an item by dragging it into the appropriate status column.
Note: You can see in this view that the same tasks that were showing up as red/overdue in the kanban and the list view are still showing up as red in the 2D view. This makes it easy to see that something is at risk.

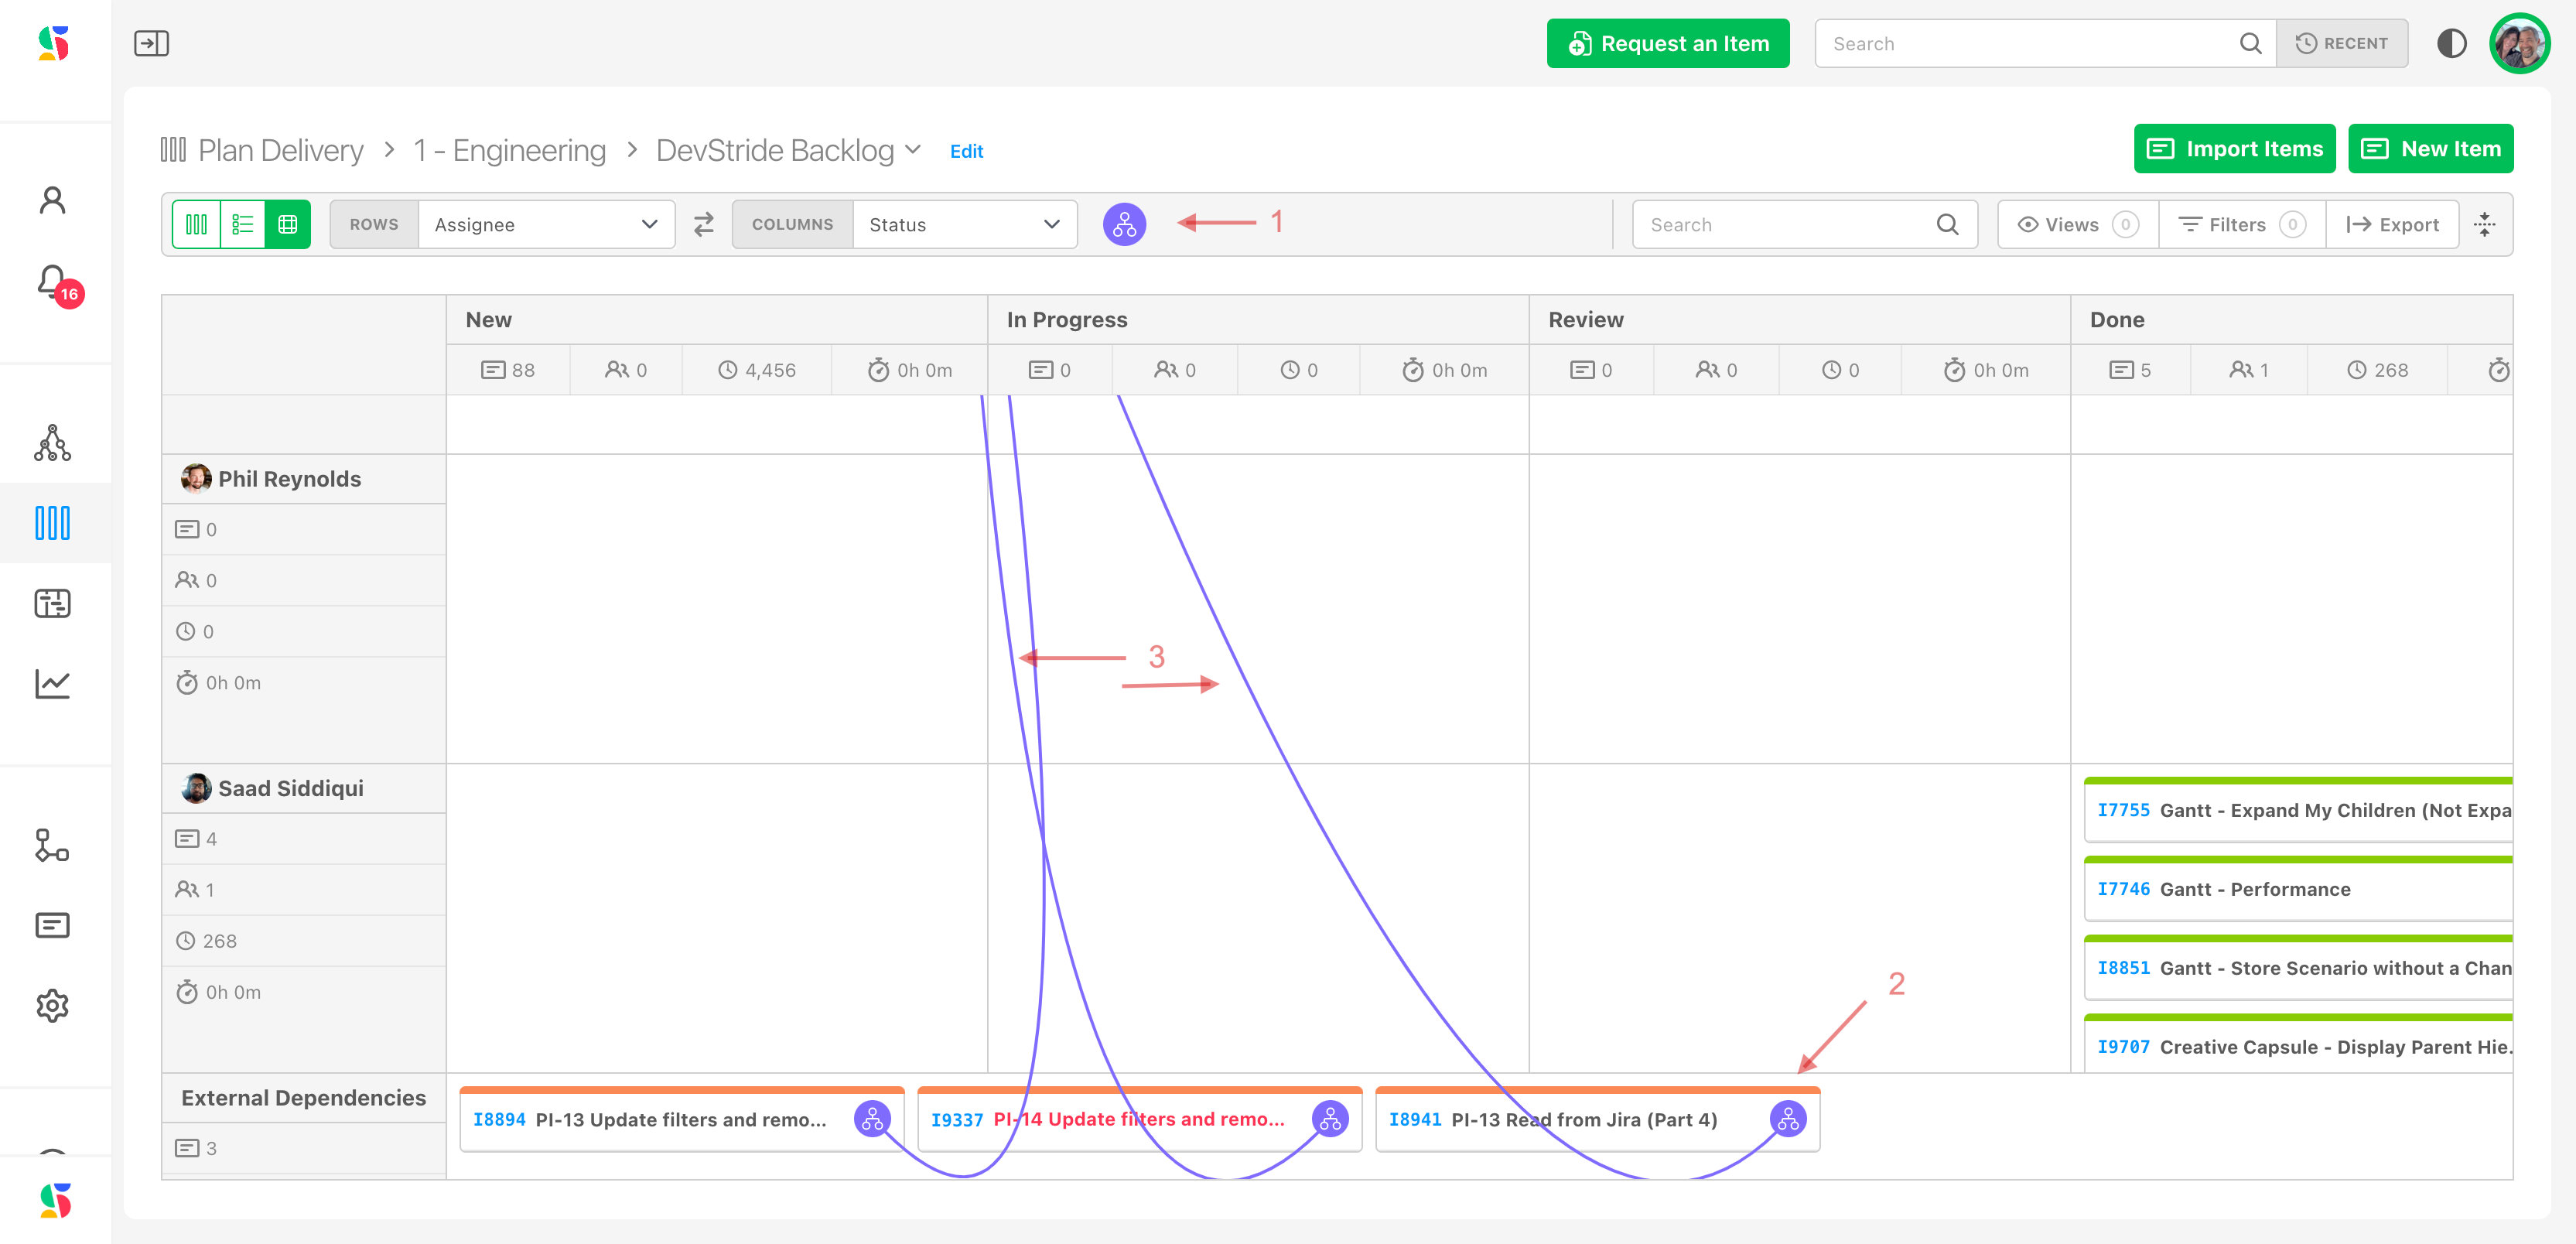
Another powerful feature is this board's combination of relationship map and internal/external dependency display.
You can click on the relationship map if you would like to see the relationships drawn out on the 2D board (1).
DevStride also provides you with the ability to see a "gutter lane" - in other words, you can see dependencies/relationships that fall outside your team (2).
DevStride includes the gutter lane in the 2D view (as well as all other rows), rendering a complete picture of all the relationships in the view you have chosen (3).
You can see here that there are some external relationships that connect to some of the unassigned and overdue tasks on this board. This can help you to address any issues before negative downstream effects occur.
Step 7: In each type of board, edit views and columns as needed
The 2D board will display the values you decide to include - you can also show these boards by other data and can filter, and create views, etc. using selections from the control ribbon at the top:
Click the icon in the board header that you wish to use: Views, Filters, Sort, Options:
Add, remove, or reorder columns to match the way you wish to see the data (e.g., apply the Priority filter to only show high-priority work).
Step 8: Saves and share Views, as desired
Click here for how to Create and Use Views.
Step 9: Create New Items, as desired
Create new items directly on the board using the “+ Add Item” button in any column
Step 10: Monitor and Manage Work
Boards in any view is a wonderful staging and monitoring area for viewing, discussing, sharing and managing work with stakeholders.
Drag cards across columns as work progresses.
Click into any card to update status, add comments, assign owners, or adjust metadata.
Use filters in the top-right to focus by team member, priority, status, or tag, etc.
Archive completed work periodically to keep the board clean.
Advanced Functionality
Calculated fields: Use formulas to track cycle time or SLA metrics.
Automation: Create automations to move items when status changes, assign owners, or update fields.
Export Data: Using filters as needed, click on export in a .csv file.
Note - powerful reporting and analytics tied to these boards are available in the Reports Module.
Tips for Using Perpetual Boards Effectively
| Best Practice | Why it Matters |
|---|---|
| Keep WIP (Work in Progress) limits per column | Avoid overloading team members and bottlenecks |
| Regularly groom the board - check and maintain | Prevent clutter and maintain |
| Use tags or filters for segmentation | Helps manage specific aspects of the work |
| Avoid mixing perpetual and time-boxed items | To avoid confusing reporting logic |
Was this article helpful?