Track Progress: Setting Up Gantt Charts
- 25 Jul 2025
- 4 Minutes to read
- Contributors

- Print
- DarkLight
Track Progress: Setting Up Gantt Charts
- Updated on 25 Jul 2025
- 4 Minutes to read
- Contributors
- Print
- DarkLight
Article summary
Did you find this summary helpful?
Thank you for your feedback!
Overview
Gantt charts in DevStride provide visual roadmaps that align strategy and execution across multiple teams and timelines.
Gantt charts are fully integrated with all the modules the tool — including boards, cadences, dependencies, and analytics — giving you a real-time view into how work moves through time.
And speaking of time, you can get all of this and more — in a matter of minutes!
How To Do It
Step 1: Create a new gantt group
Navigate to the Track Progress module.
Click on Create New (1). Then click on Gantt Group (2).
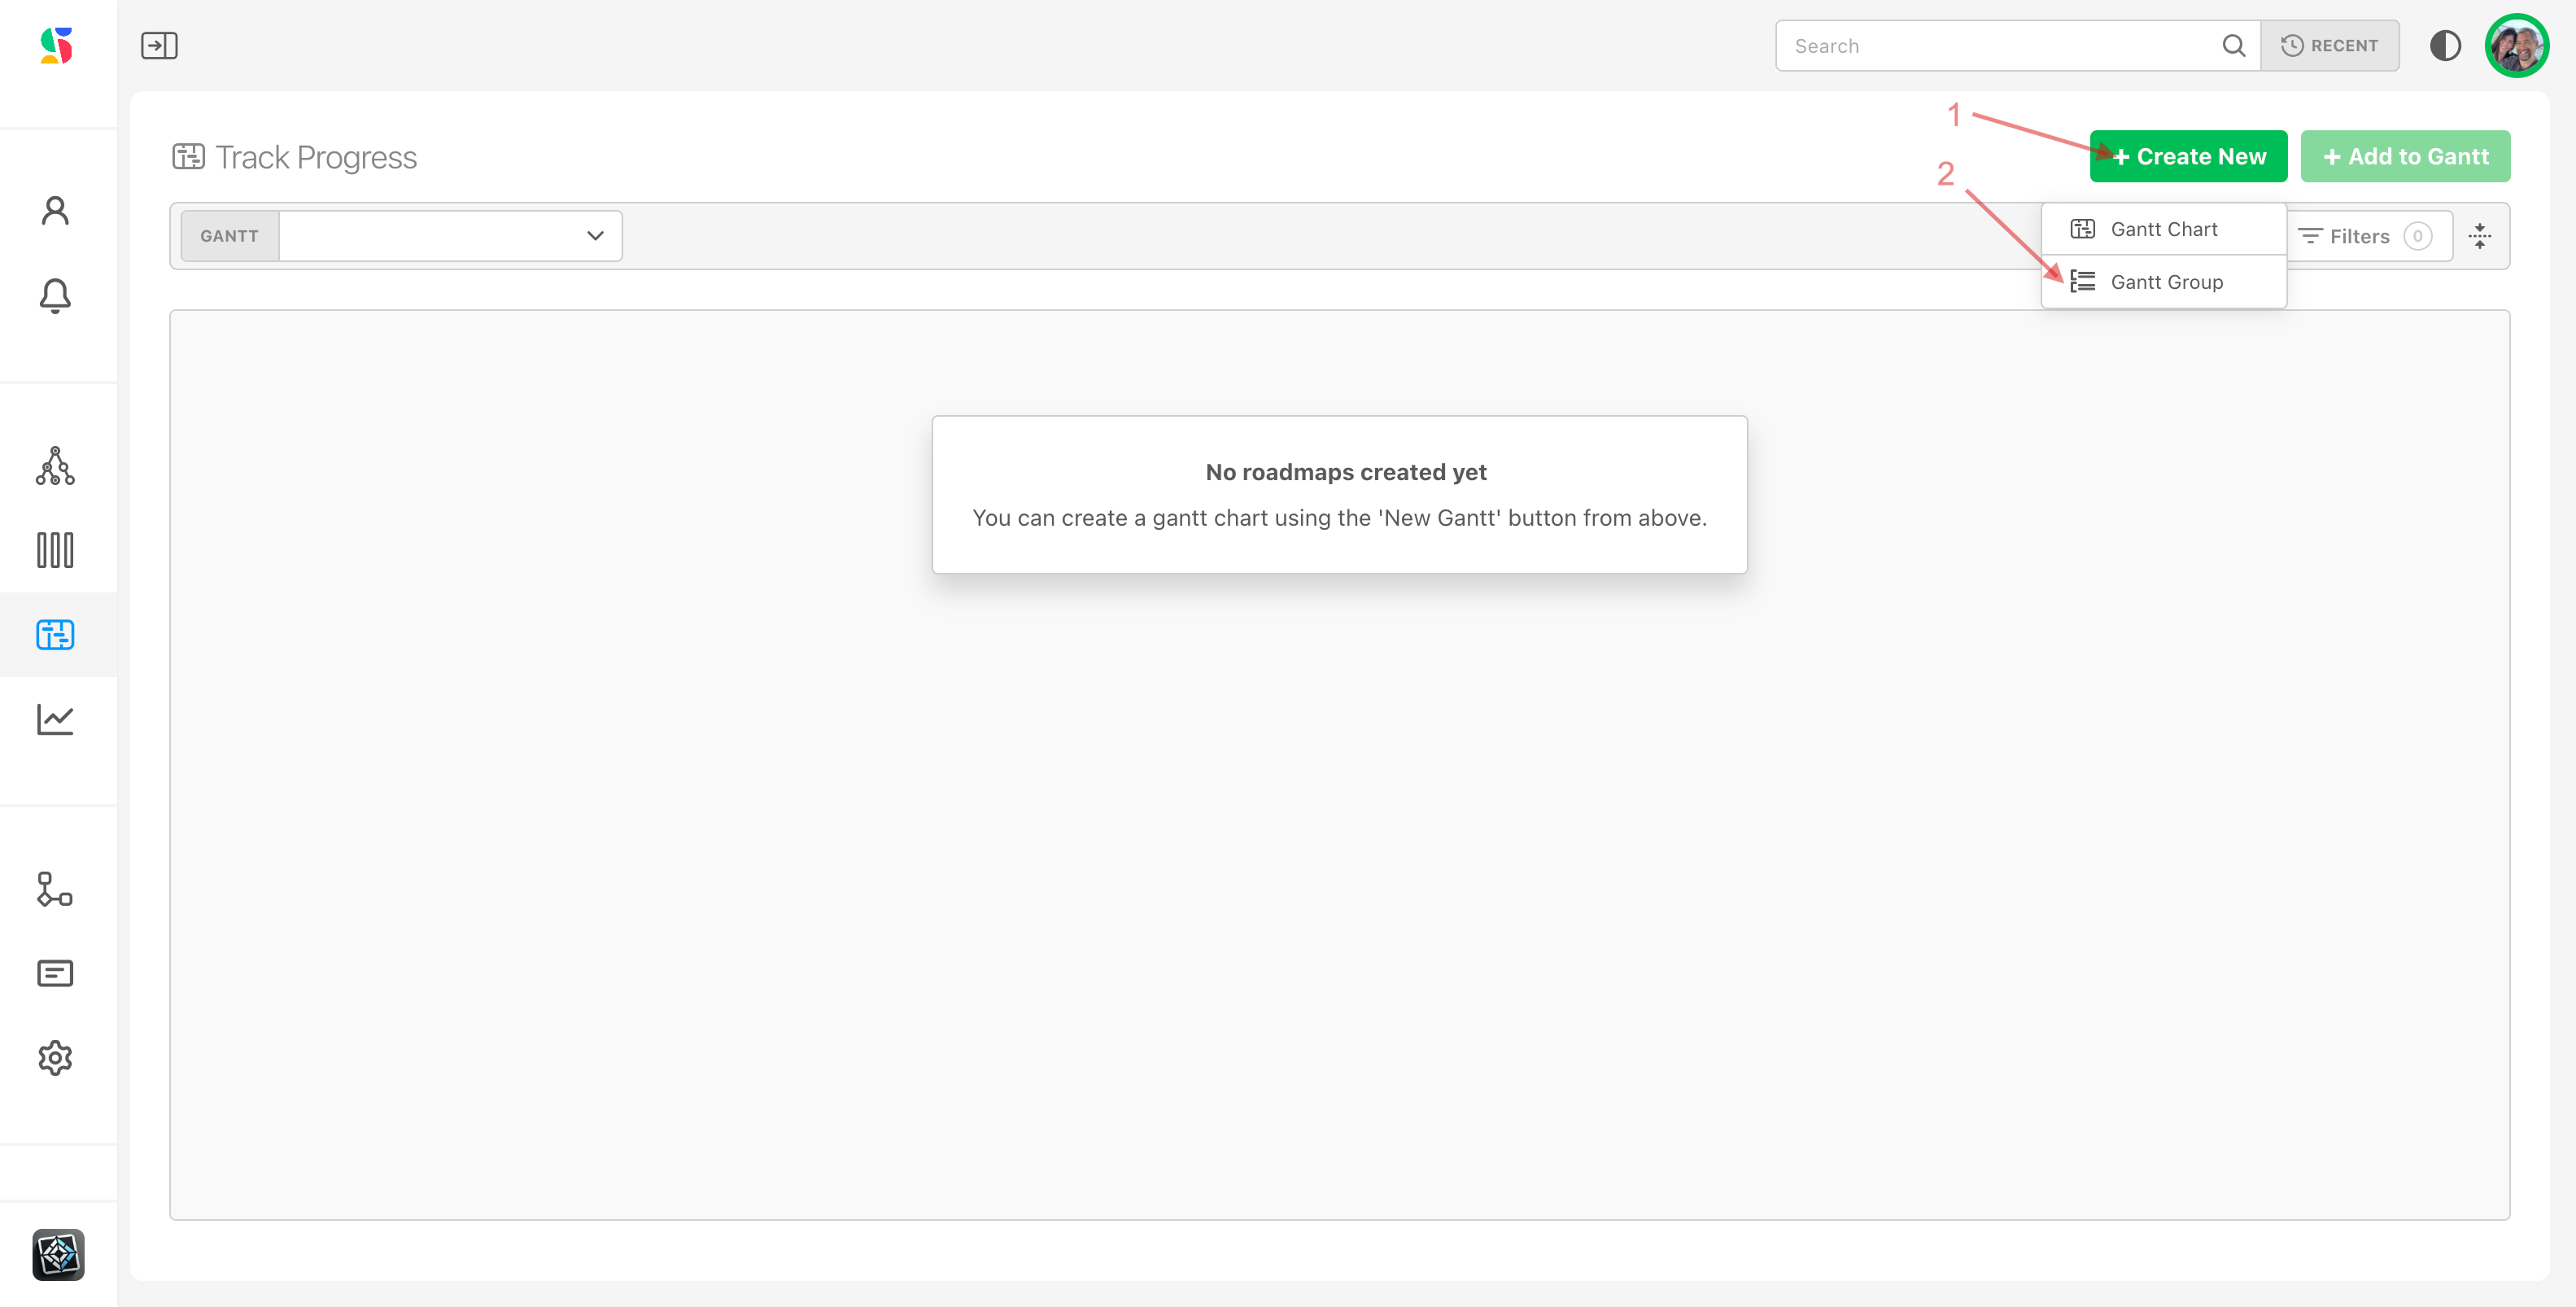
A gantt group allows you to create a kind of folder structure for a set of gantts. This will make it easy to organize. Here are a few examples of names you might use for gantt groups:
Web DevOps Gantts
Product Marketing Group Gantts
Initiative X Gantts
Product X Gantts
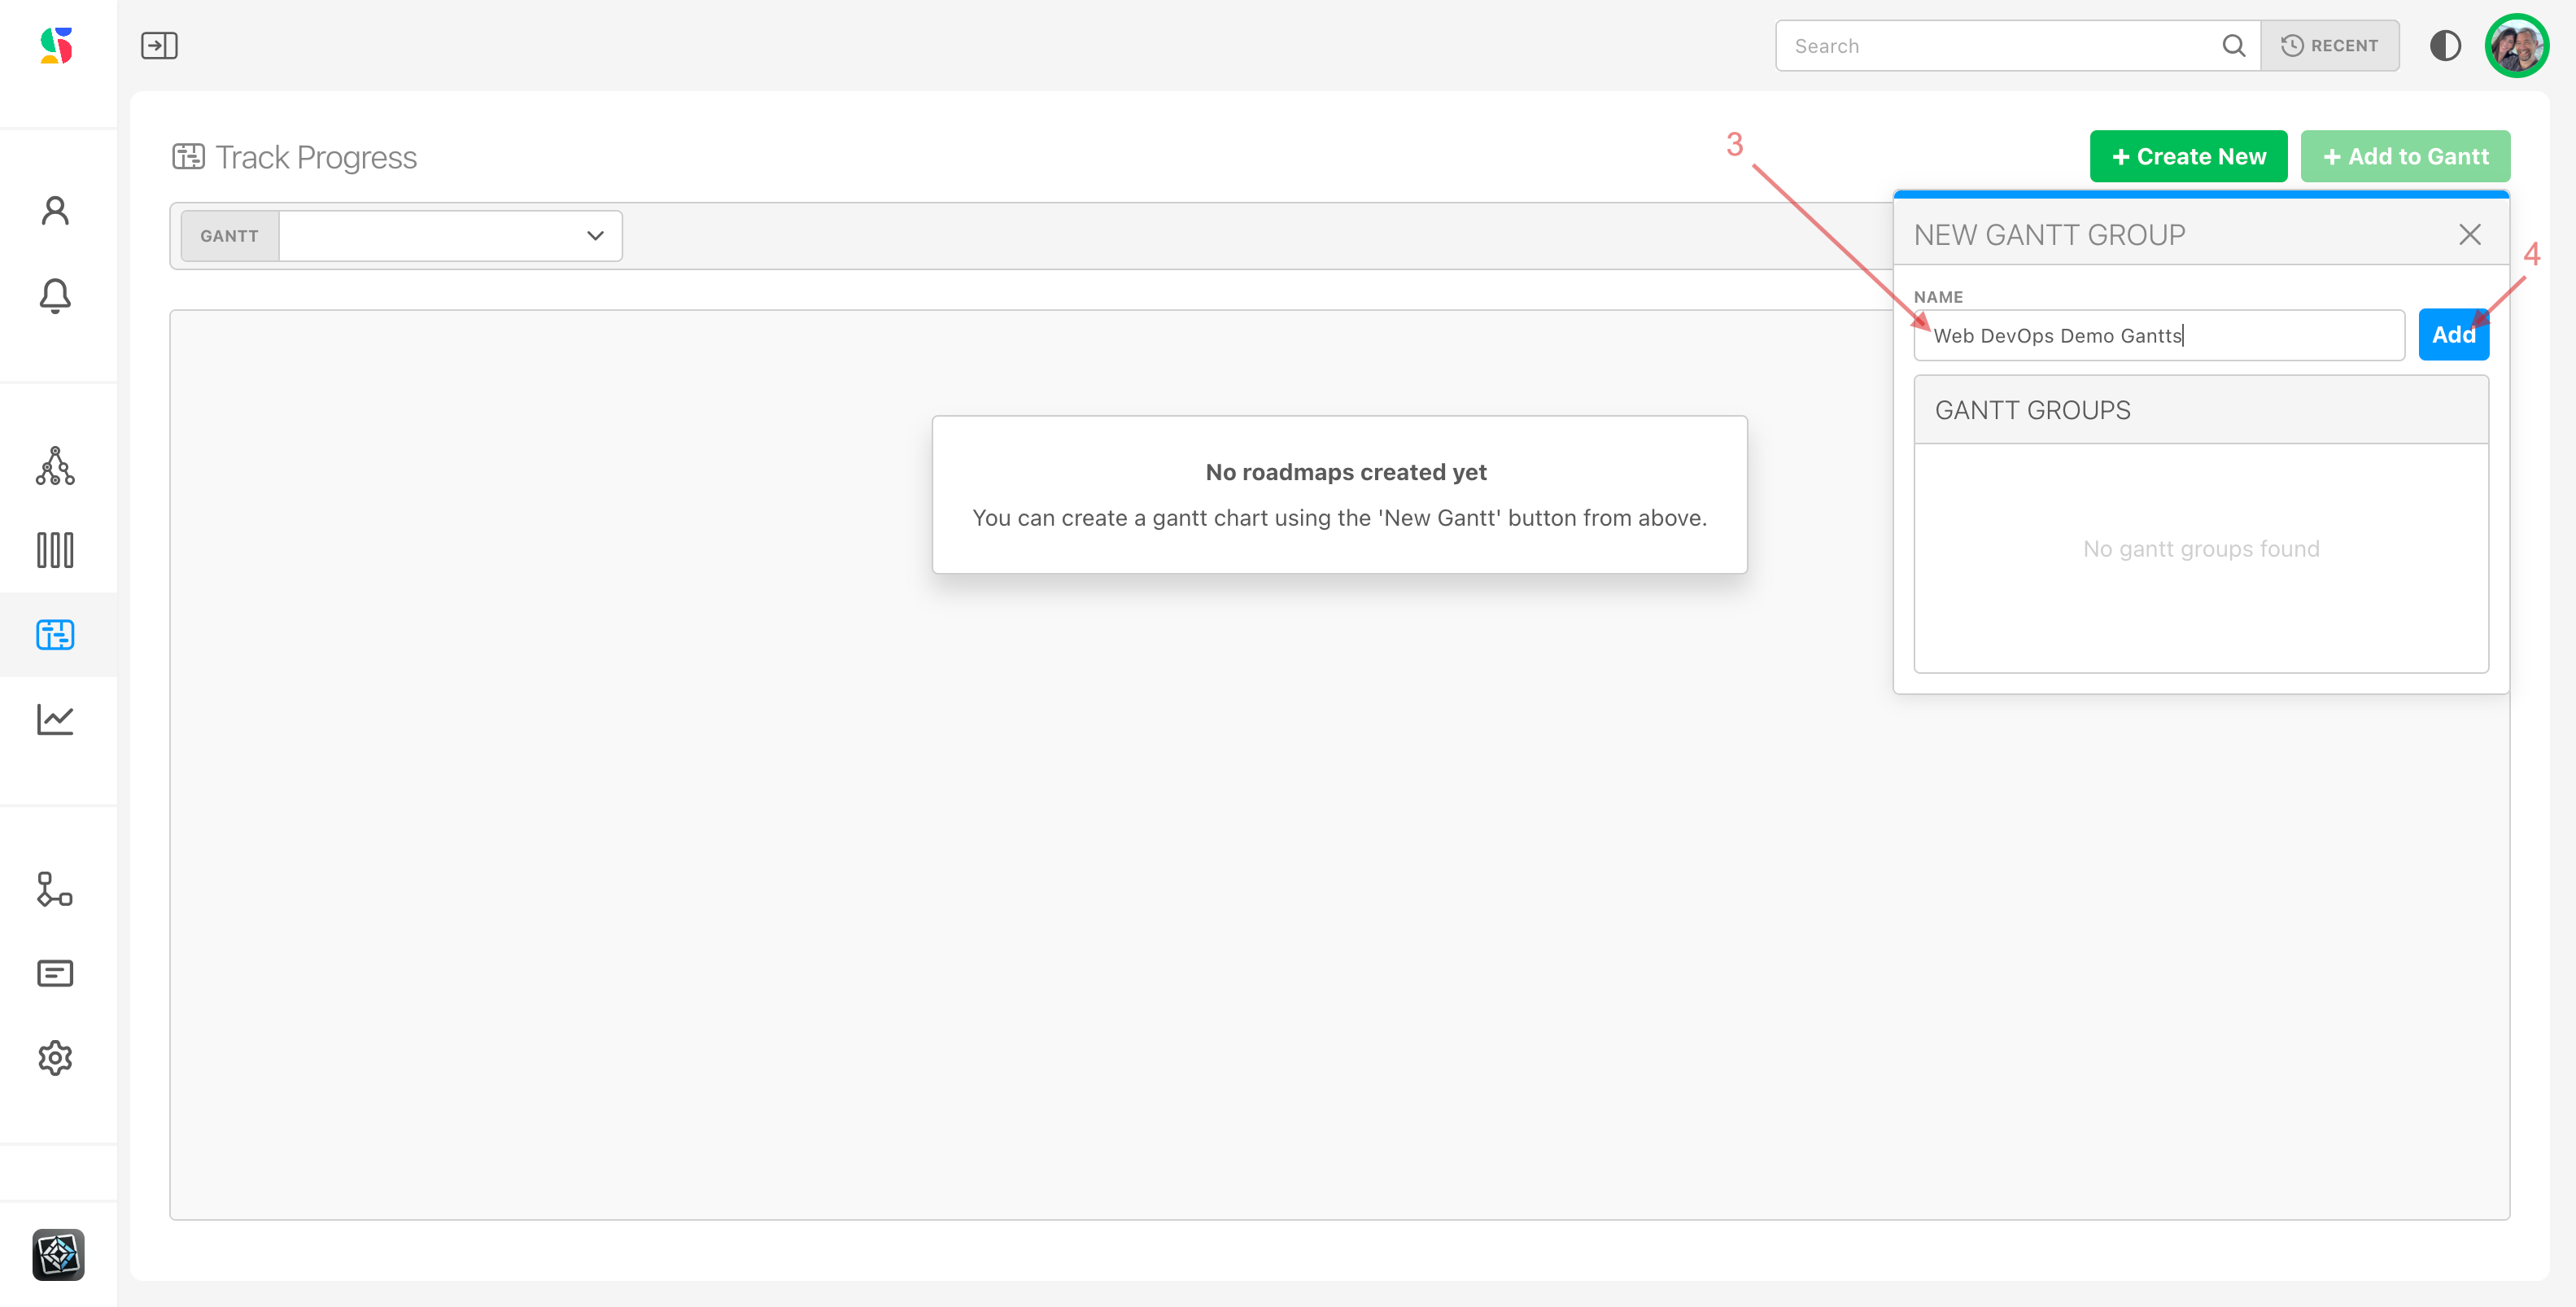
For our example. we will use the name Web DevOps Demo Gantts (3). Click Add (4):
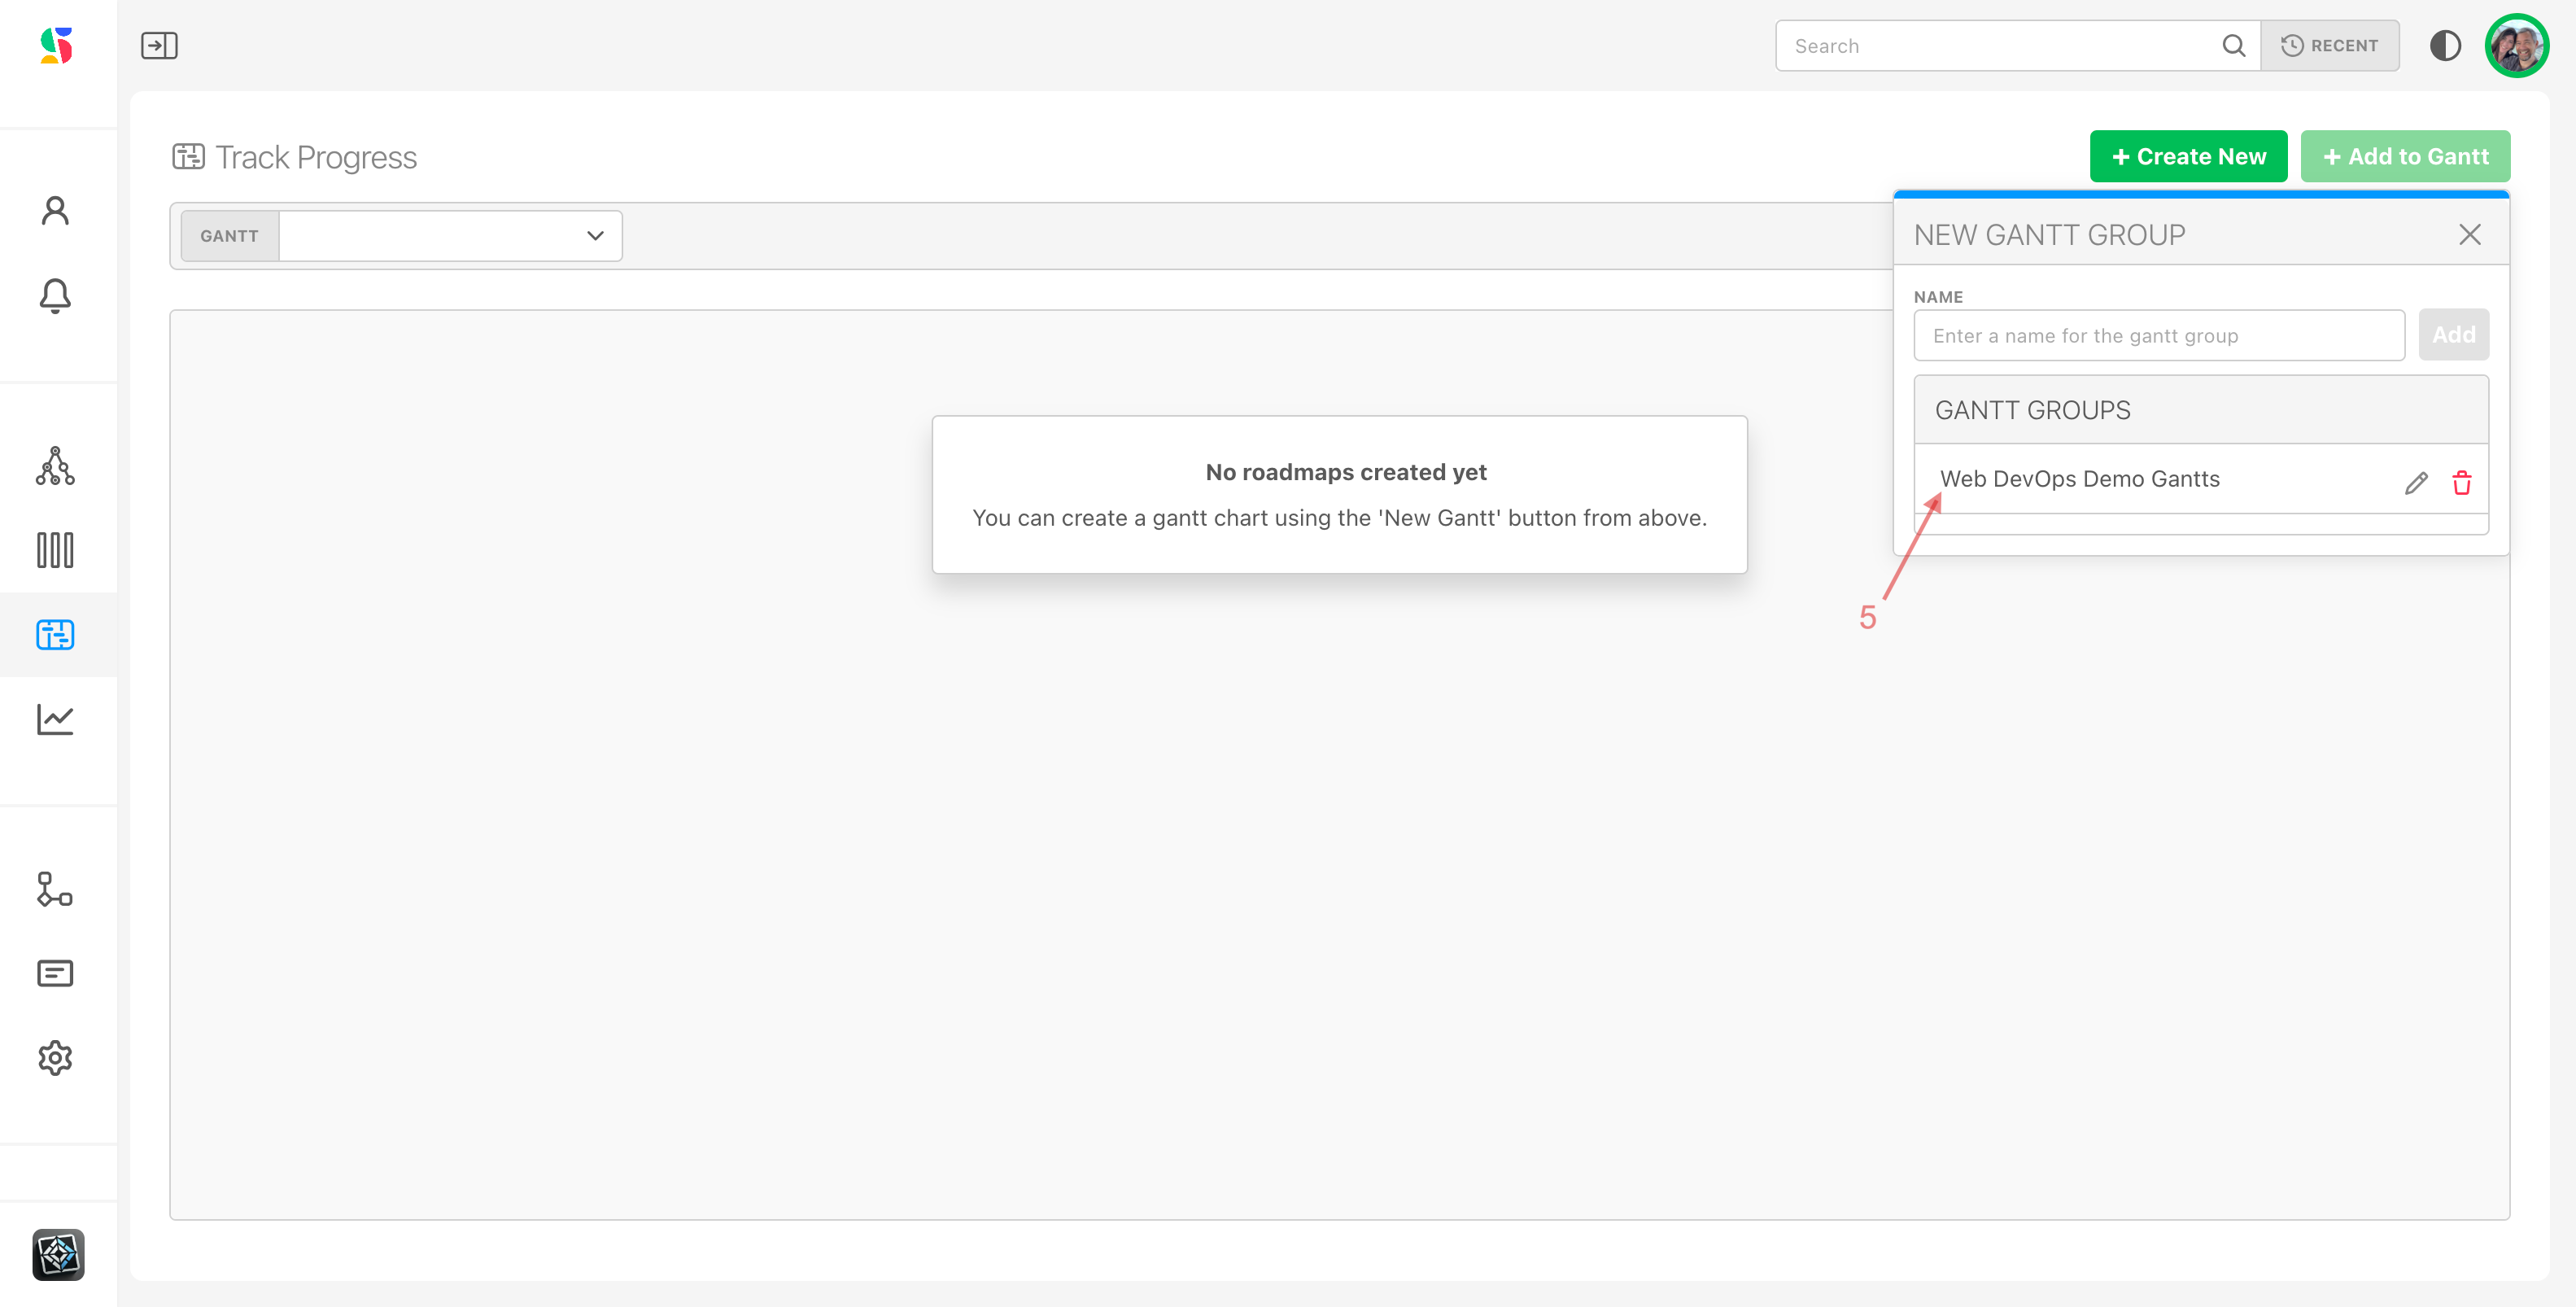
The Gantt group's name now appears in the Gantt Groups section of the box (5):
Step 2: Create a new Gantt chart
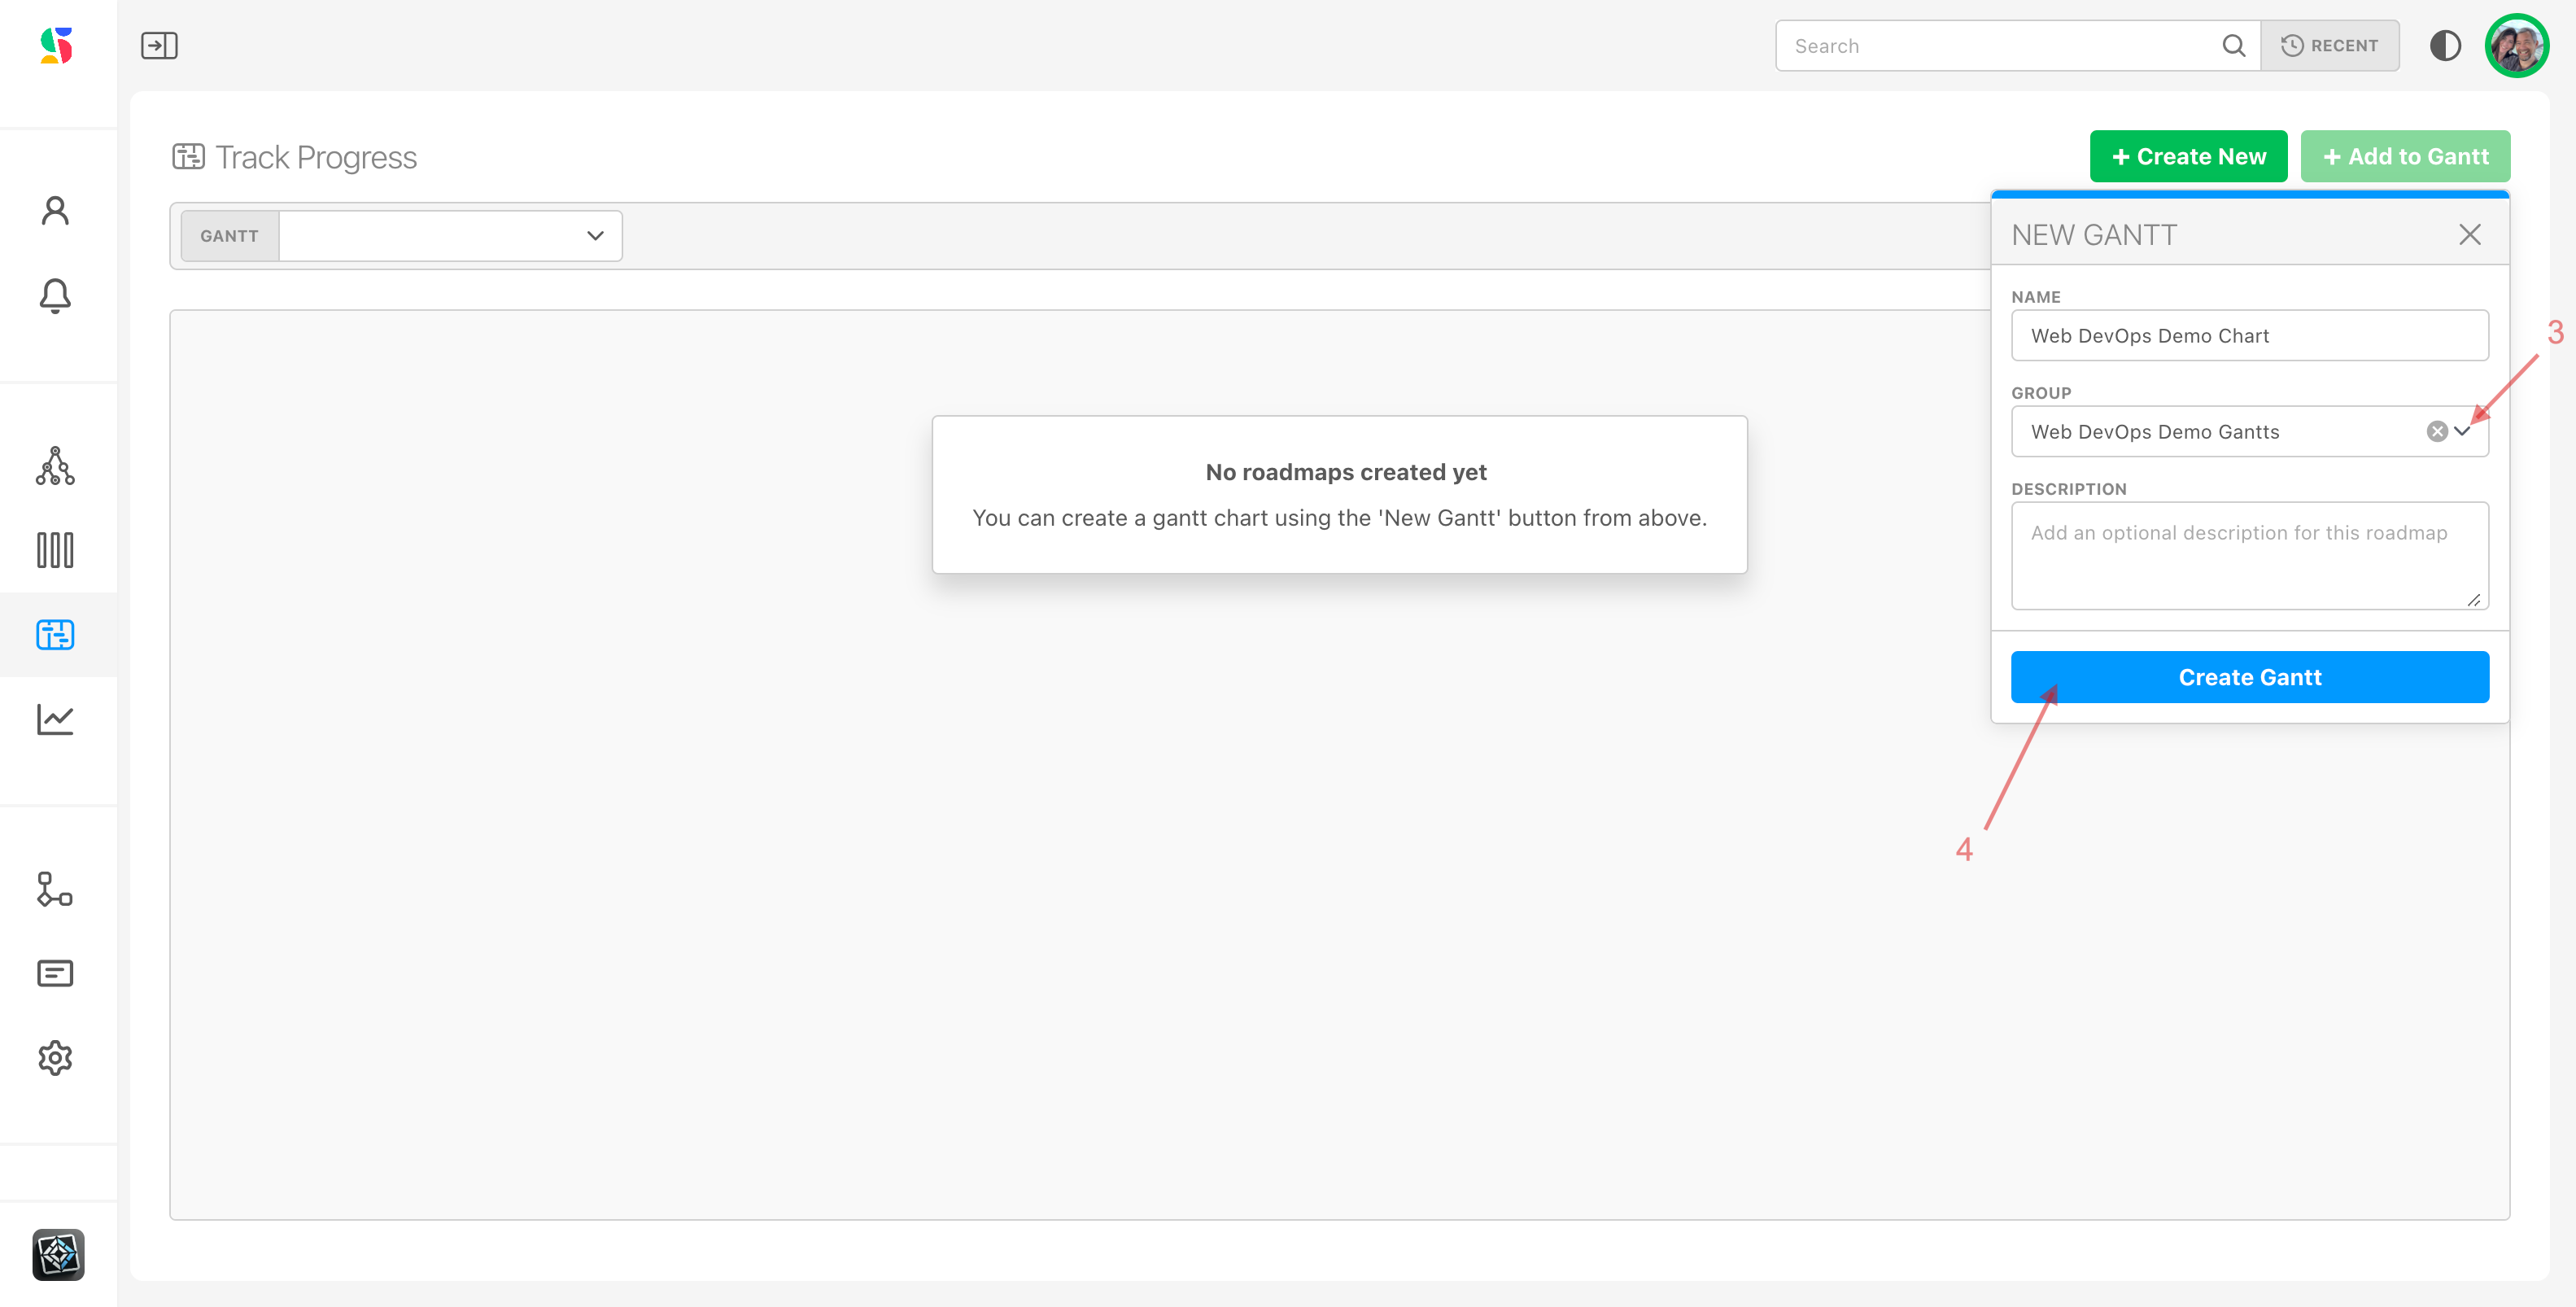
Now, Create a new gantt chart by clicking on the Create New icon again (1) and enter a name for the new gantt chart you'd like to create (2).
For our example, we used the name Web DevOps Demo Chart.

Select the Gantt group you want to associate to your gantt chart (3).
Click Create Gantt (4).
Step 3: Create an Initiative name that will contain the gantt chart items
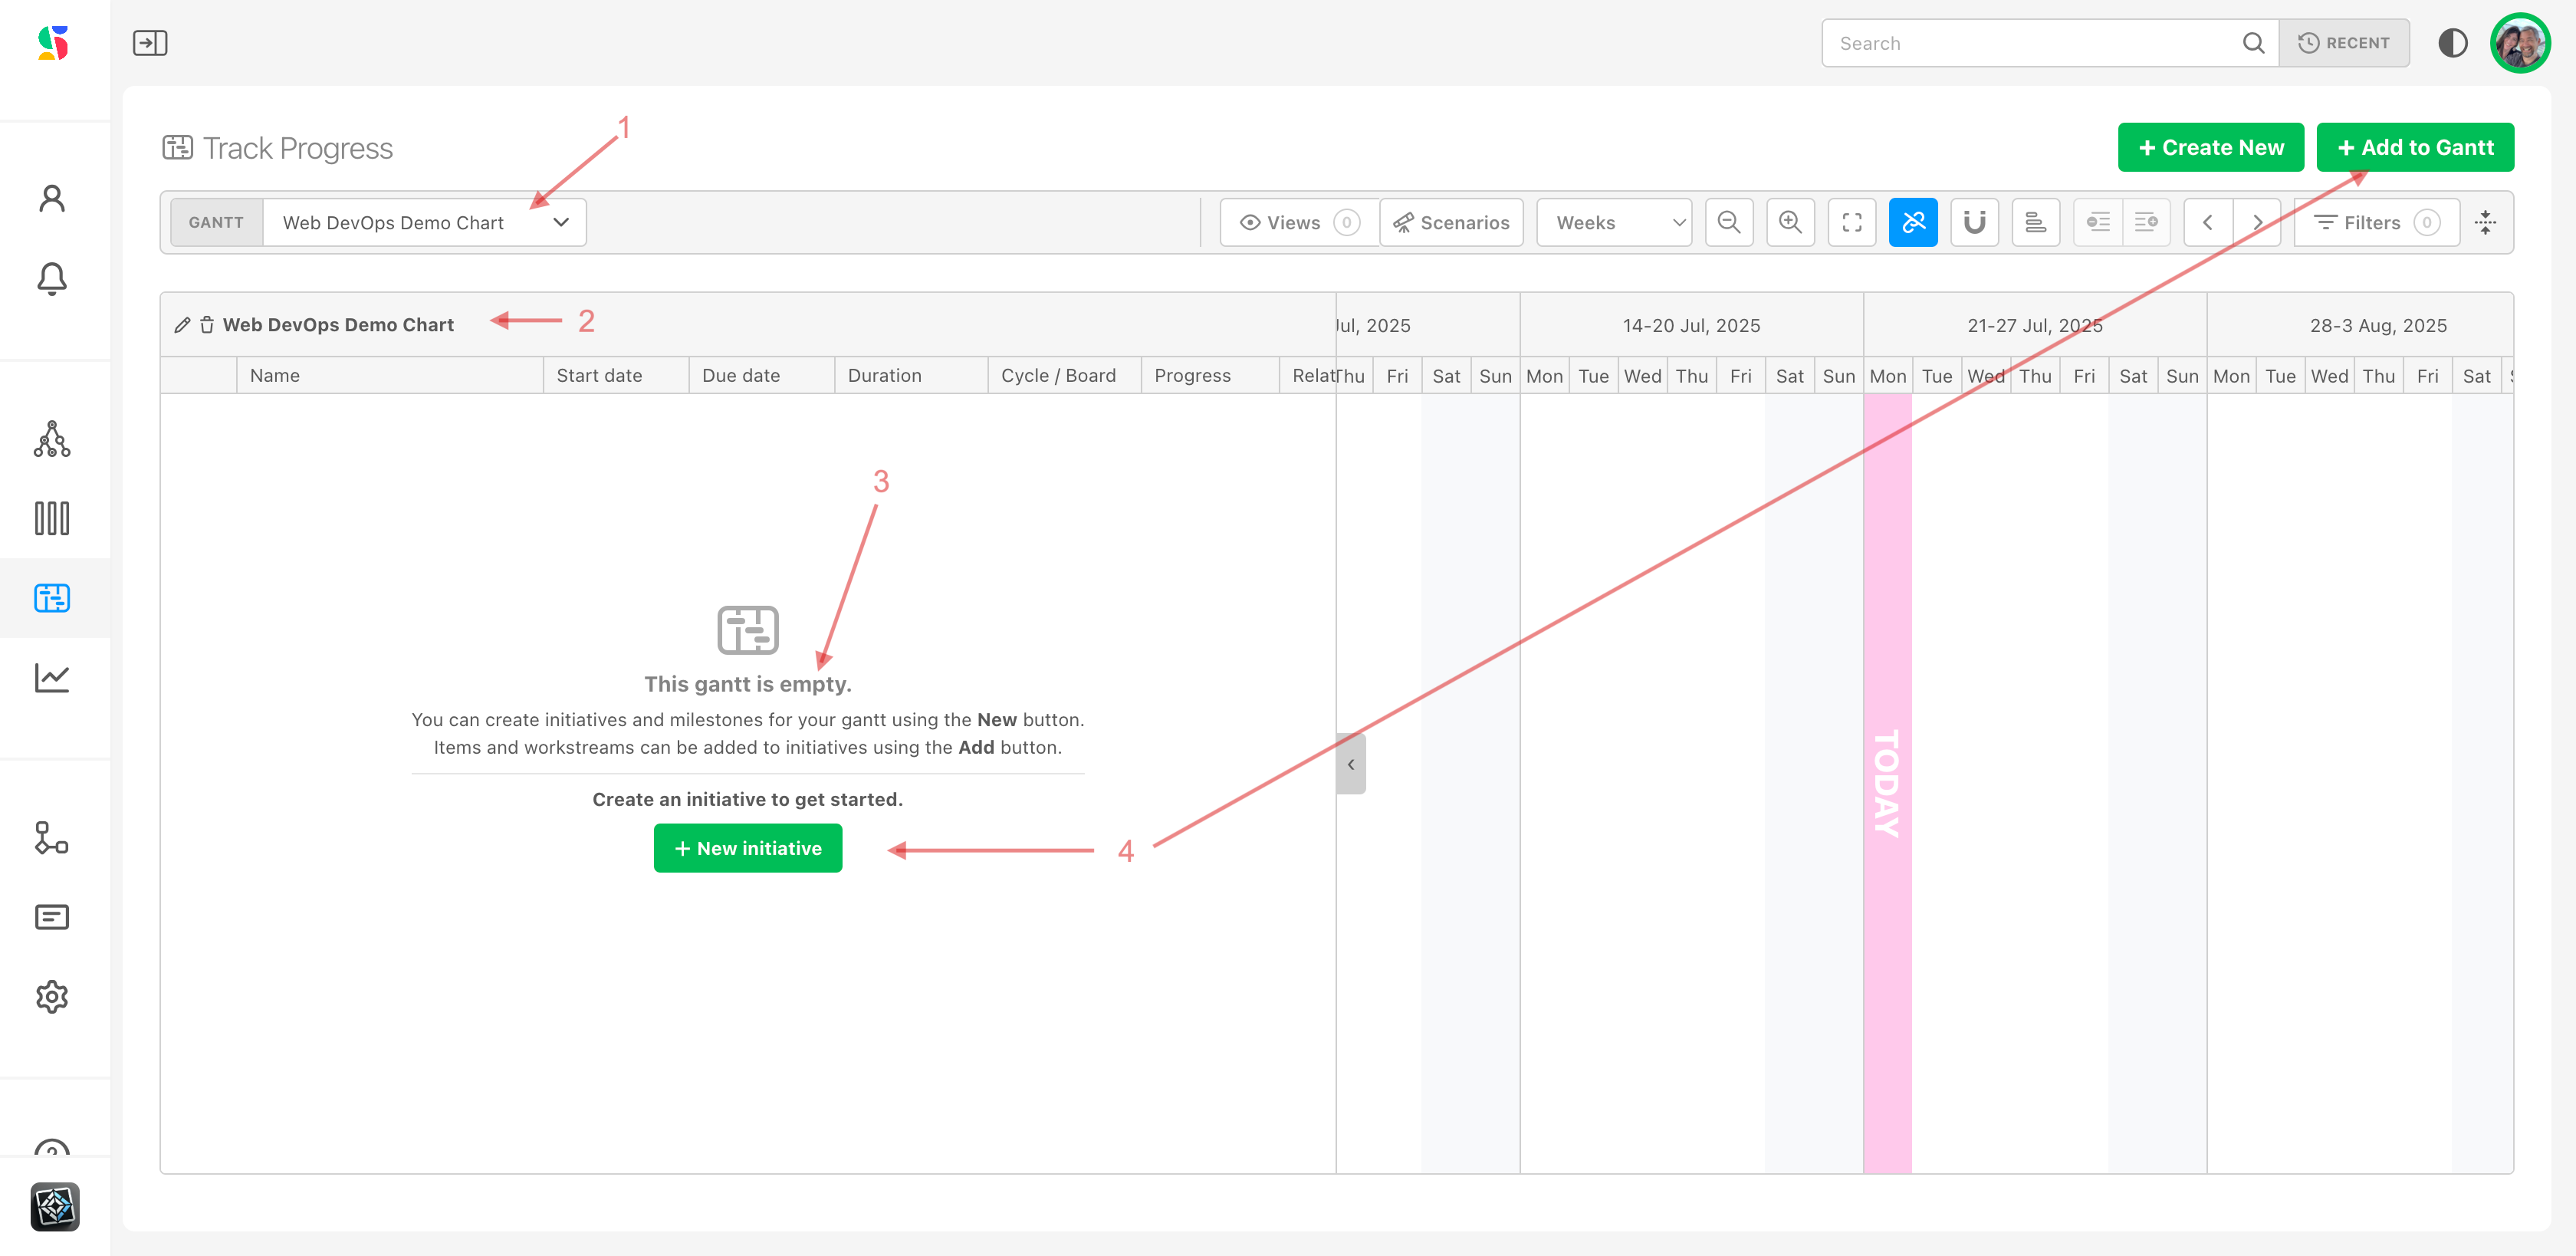
We have a name for our Gantt group and our Gantt chart, and we can see its name here (1) and here (2), but note that our gantt chart is empty (3).
The next thing we need to do in our gantt chart set up flow is to provide context for our gantt chart items. We do this by creating an initiative — the name of what we are specifically tracking with this gantt chart.
Examples of initiative name you might want to use for a gantt chart:
DevOps groups - might use "Q1 feature releases" as a name or "Product X roadmap" as a name
A marketing team might use something like "FY x Marketing initiatives" or "Client X initiatives."
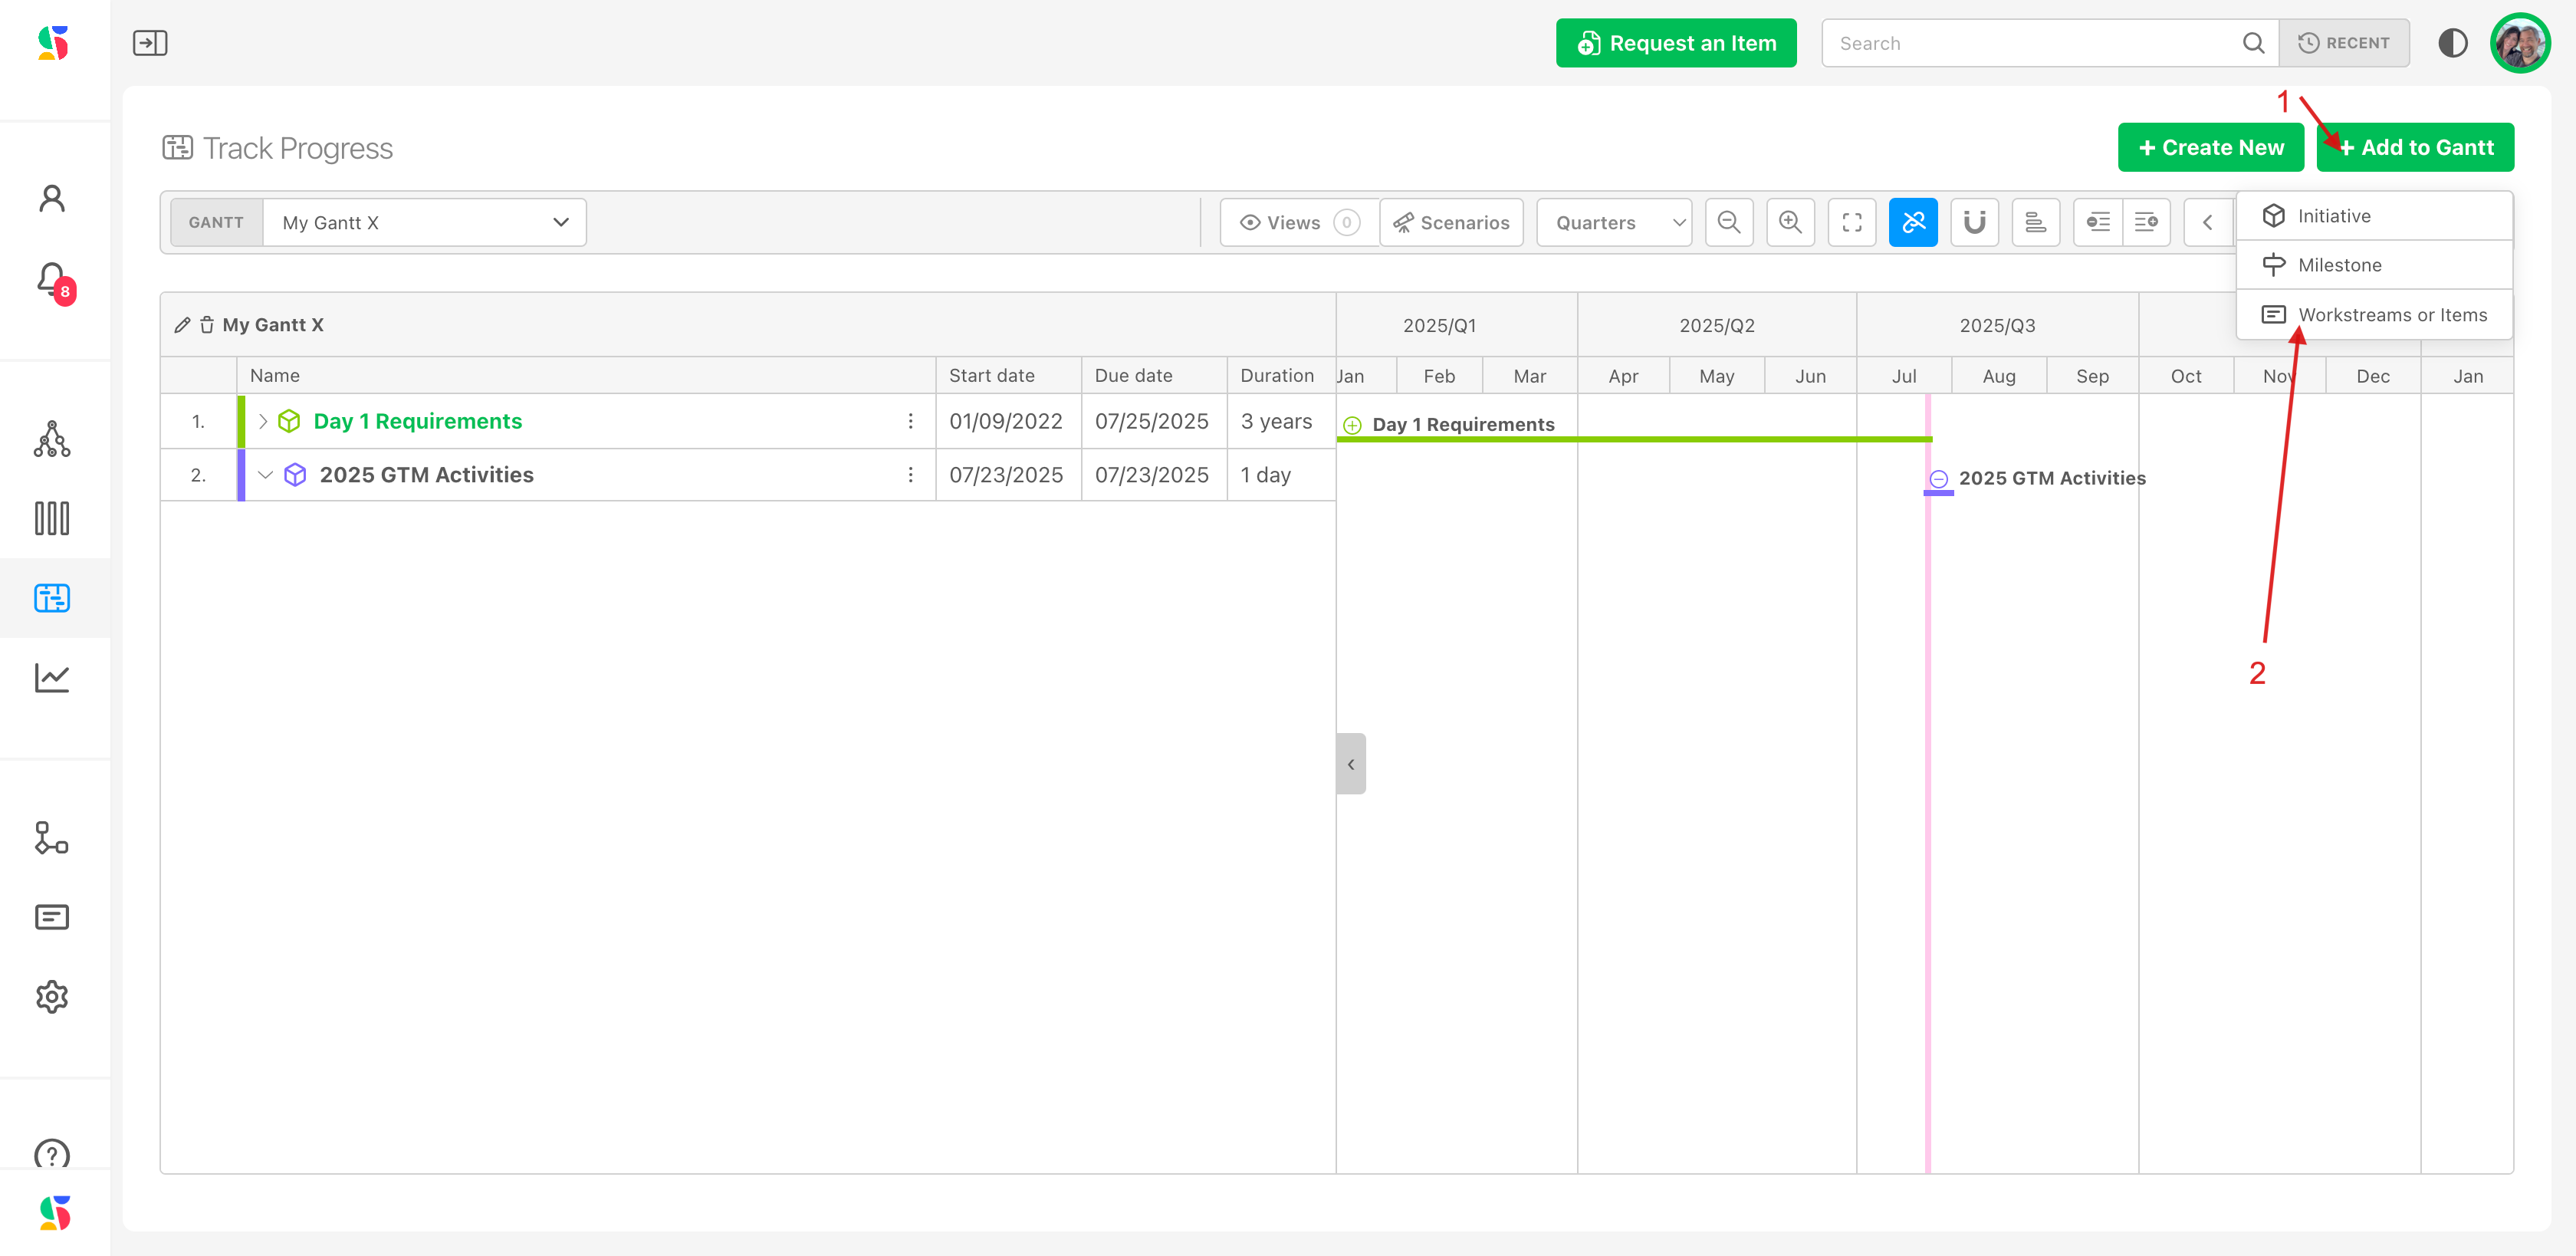
To create an initiative, click either the New initiative (4) or Add to Gantt (4) icons.
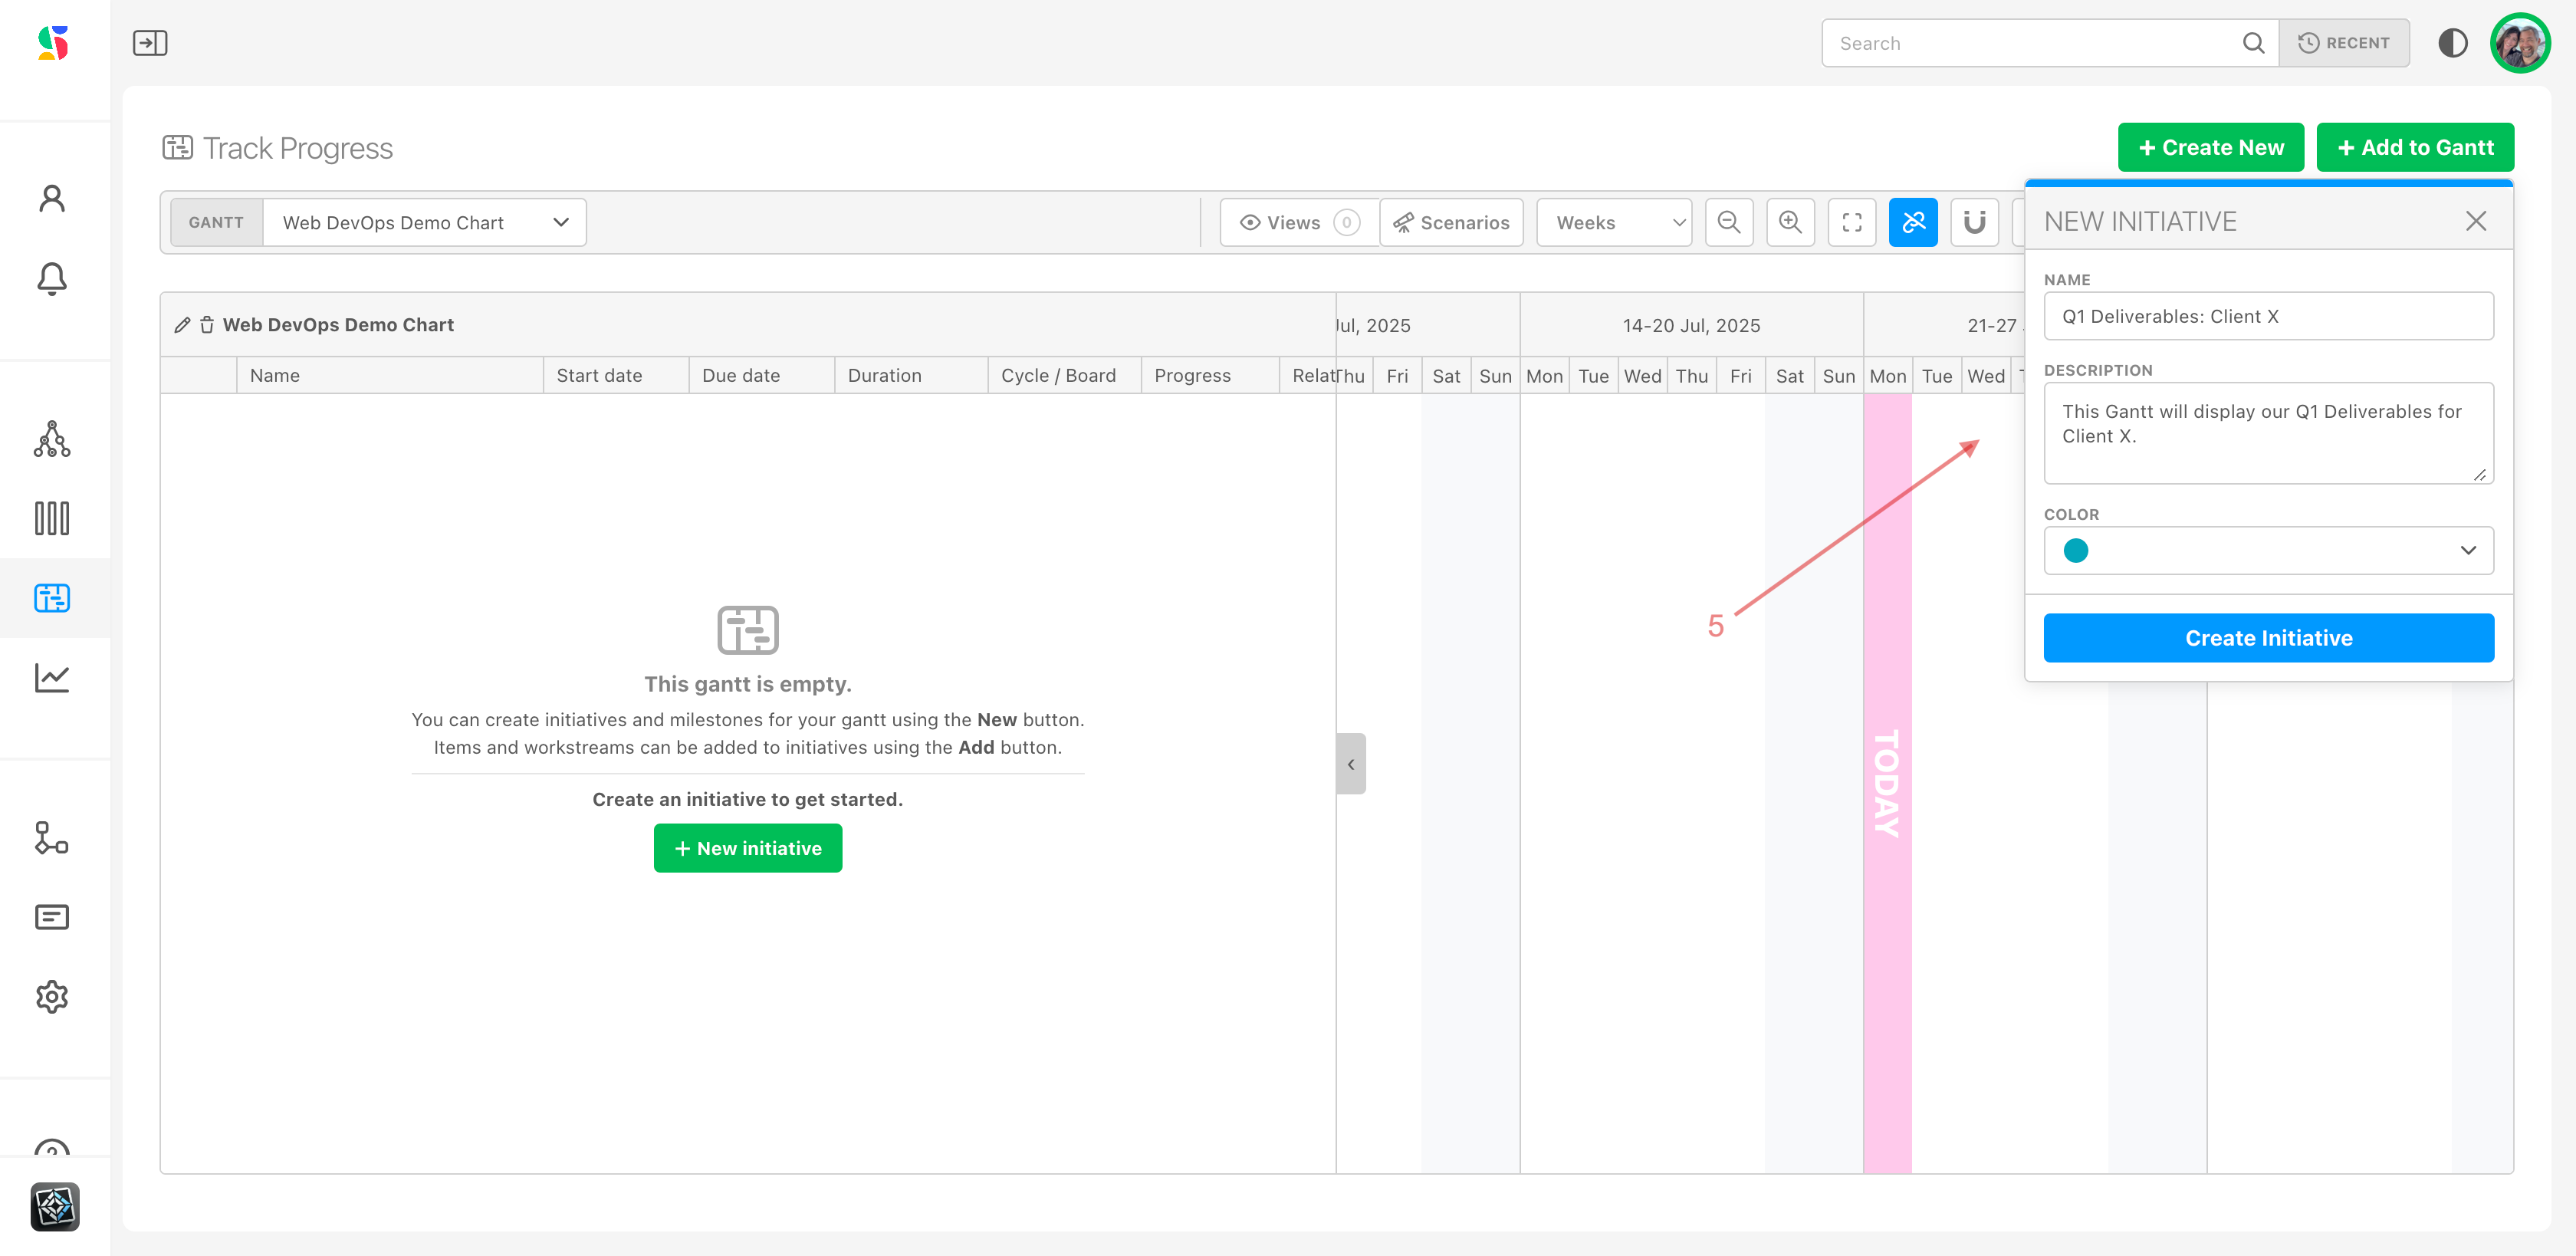
Name and create your initiative by entering the desired details into the dialog box (5), including:
- Name
- Description, if desired
- Choice of color for the initiative
Click Create Initiative.
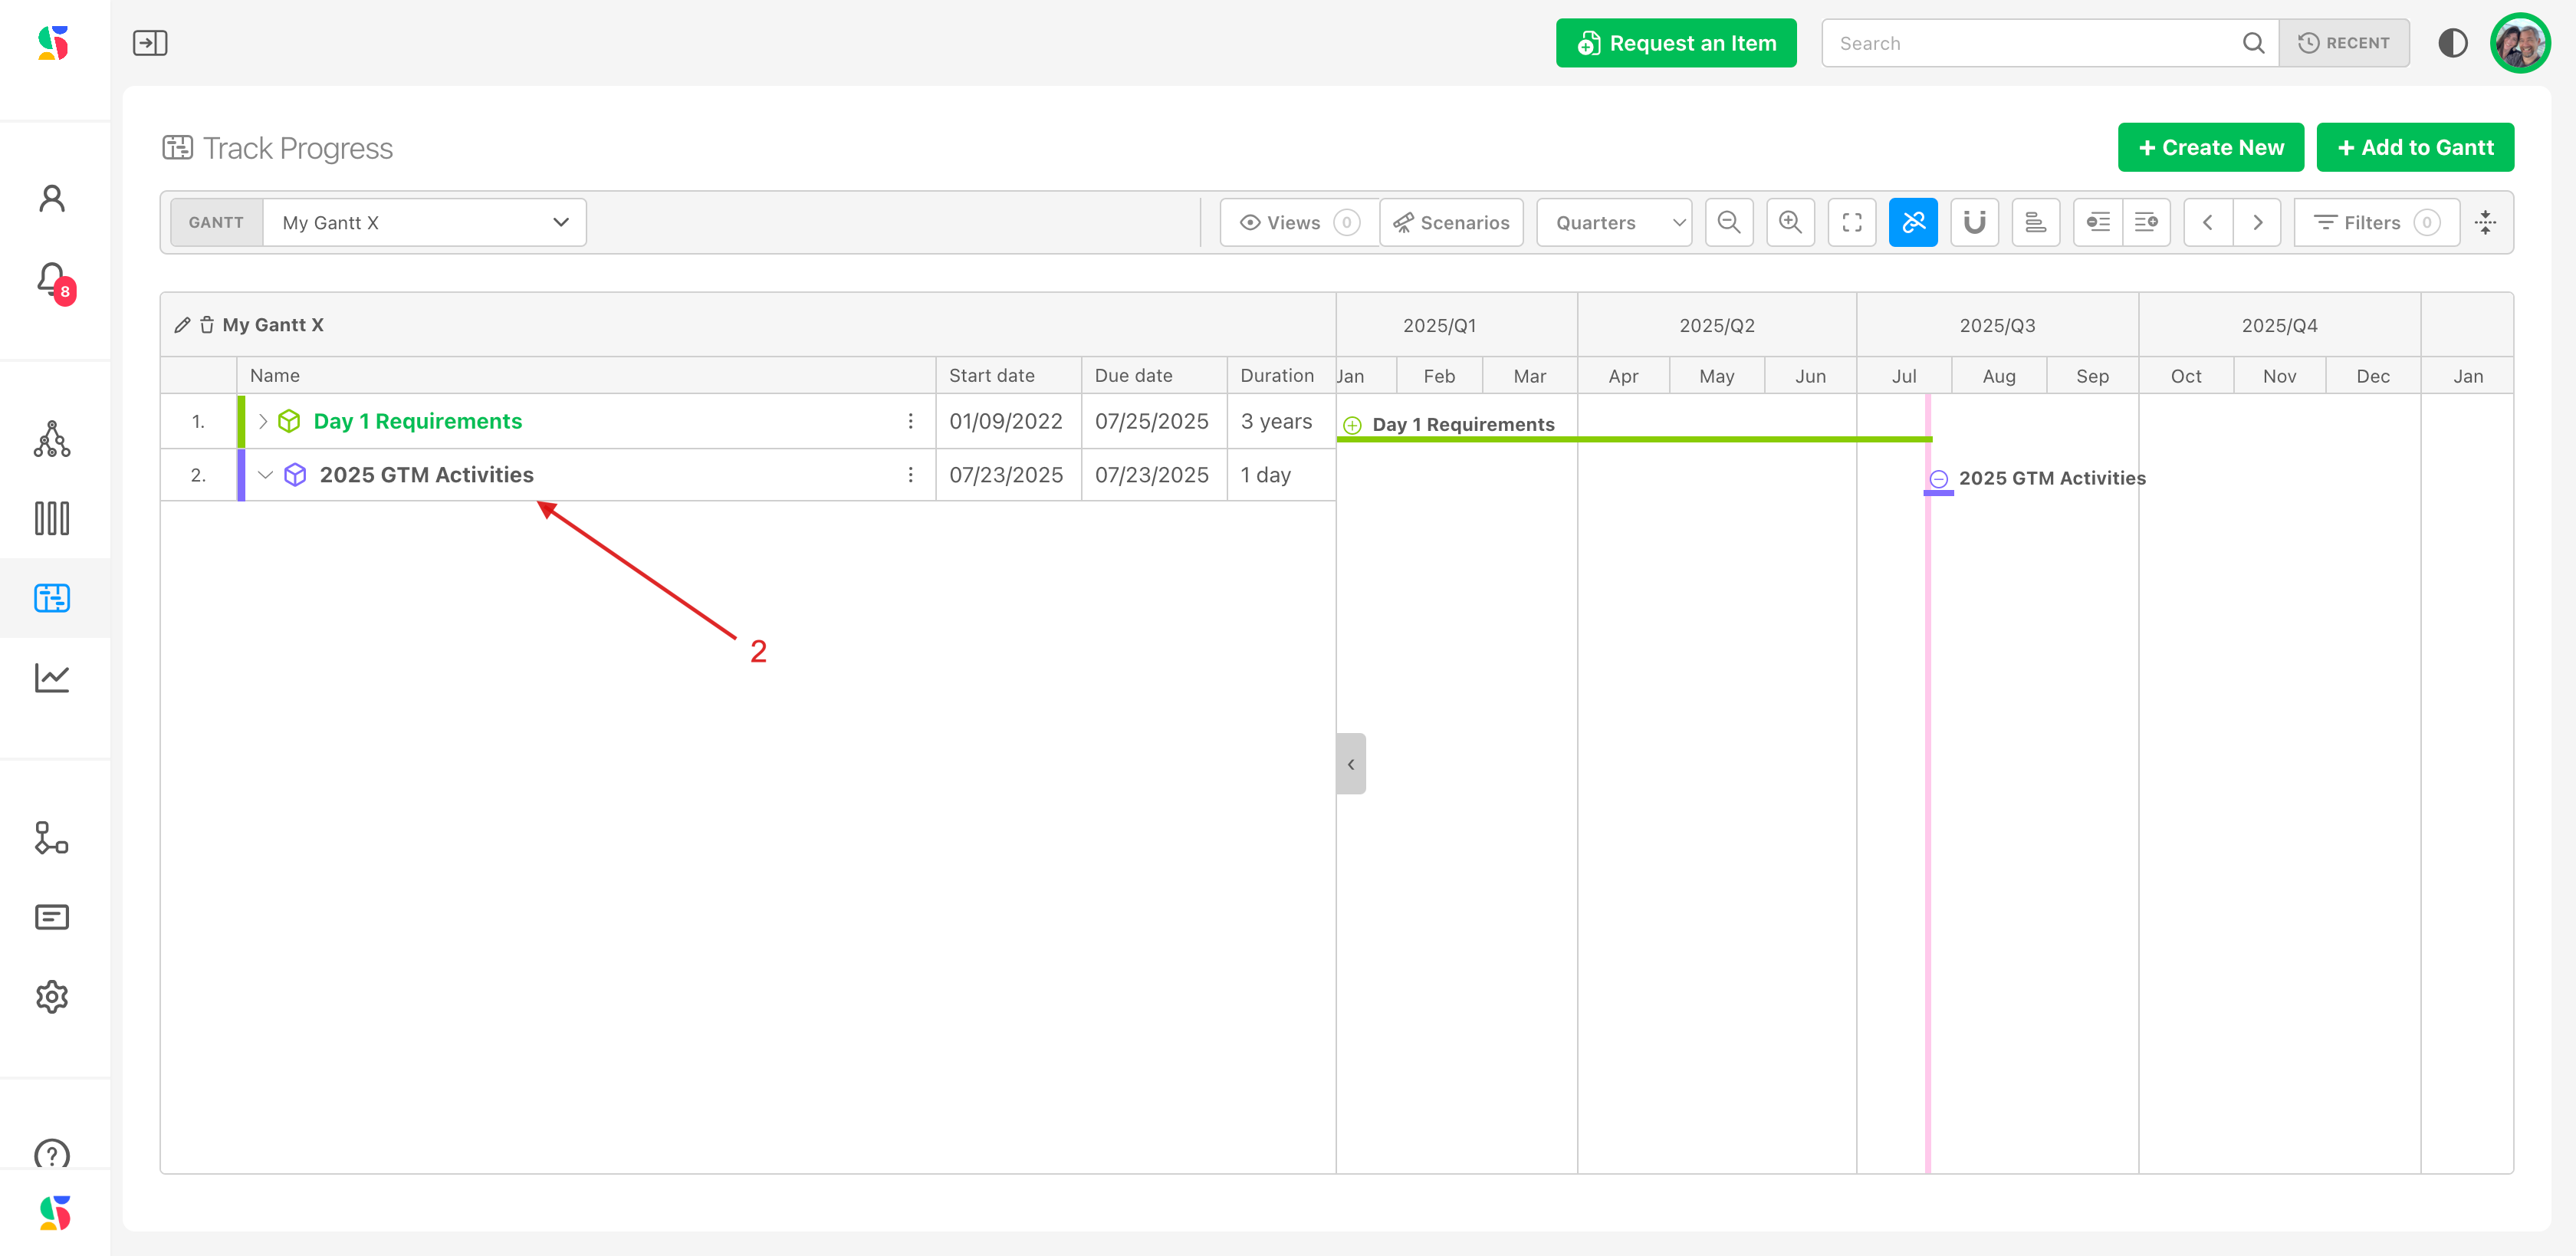
The name of the initiative now appears (6) and defaults to the current calendar timing (7). This will adjust as we add items to the gantt.
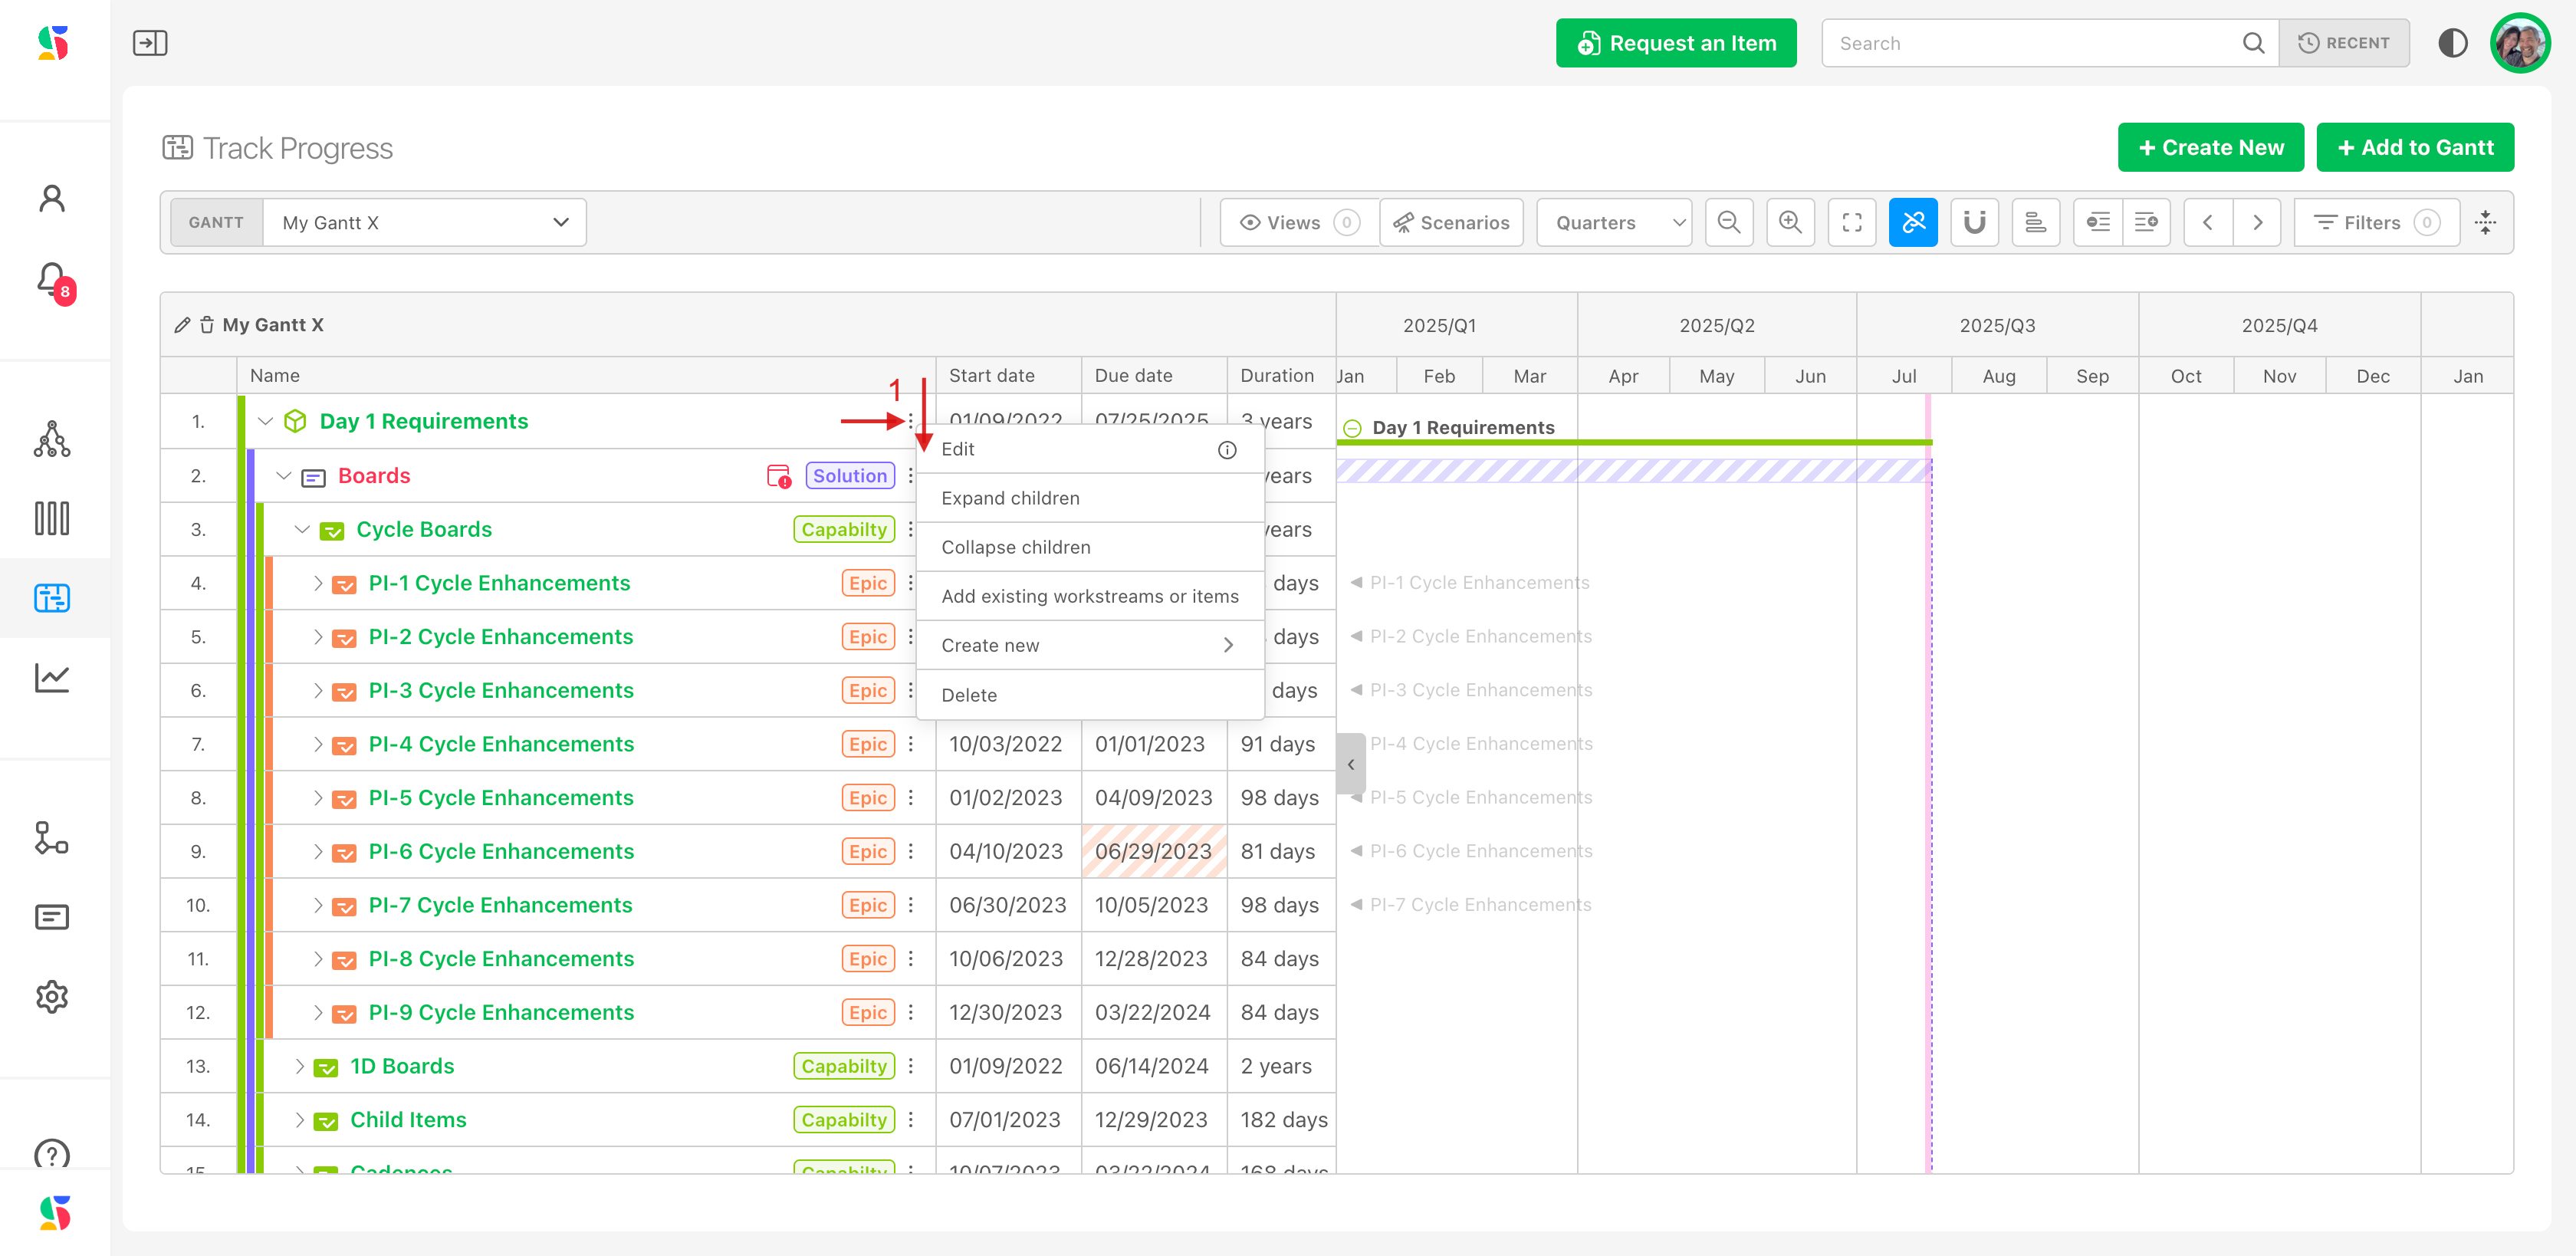
Click the kabob to the right of the initiative name to edit the name or to take other actions (1):
You can create more than one initiative. This allows you to easily house and display activities across and organization (2).
Step 4: Populate your Gantt with the work you want to track.
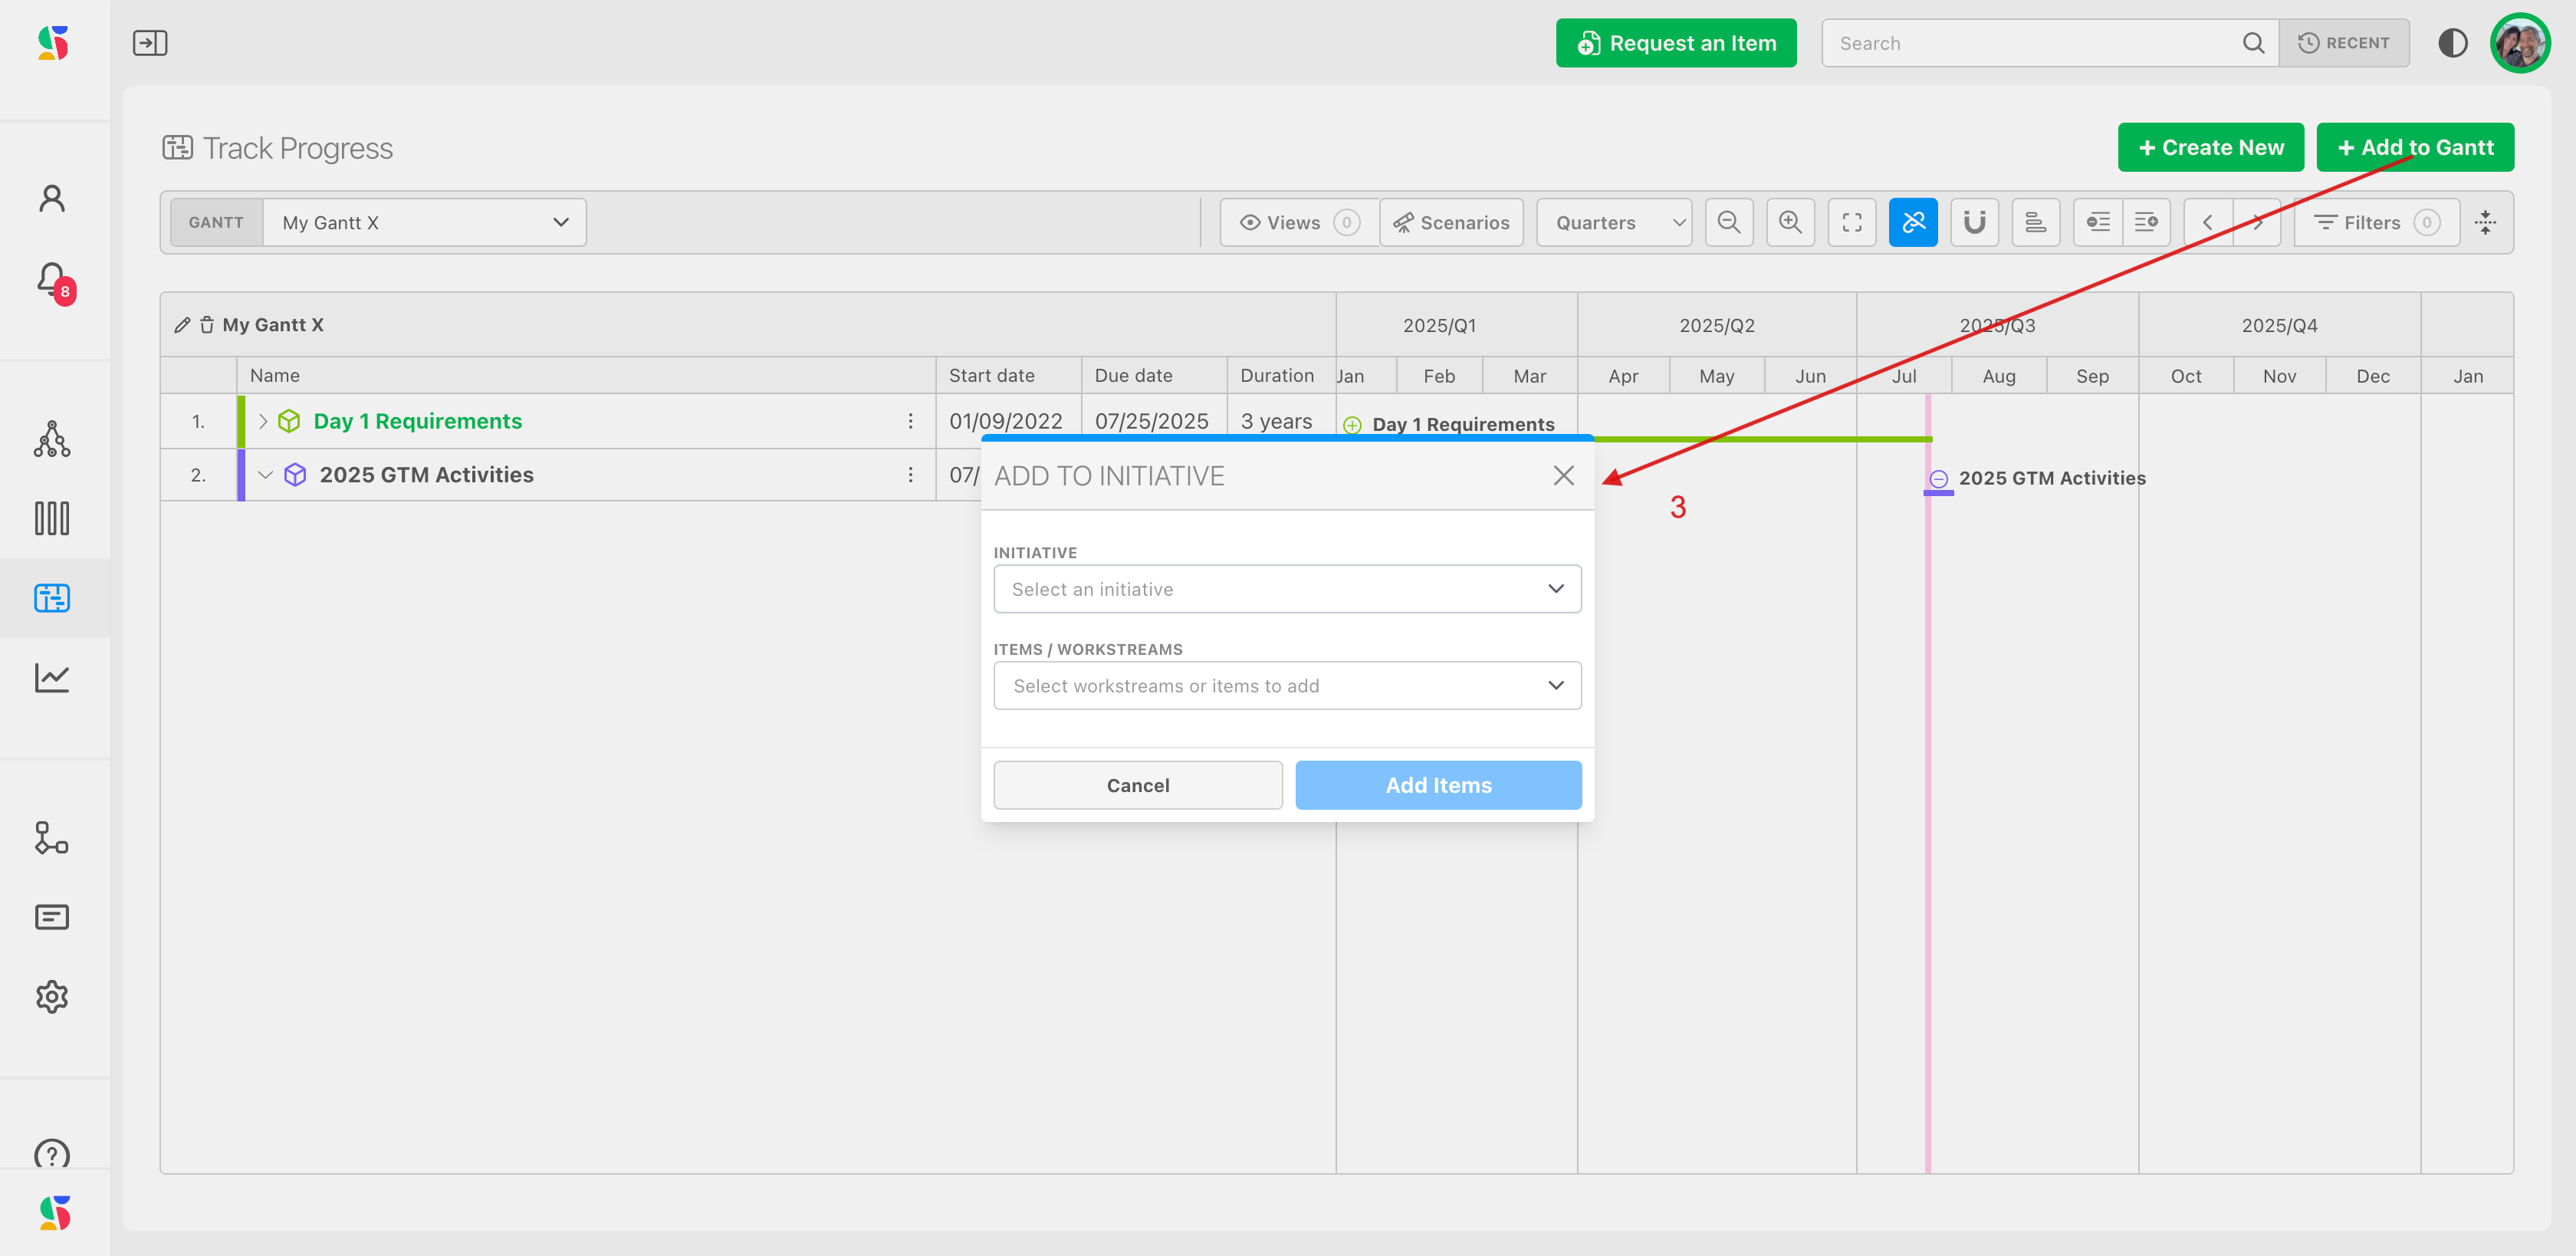
Click on Add to Gantt (1) to select what you'd like to track in your gantt chart from the Map Value workstreams (2).
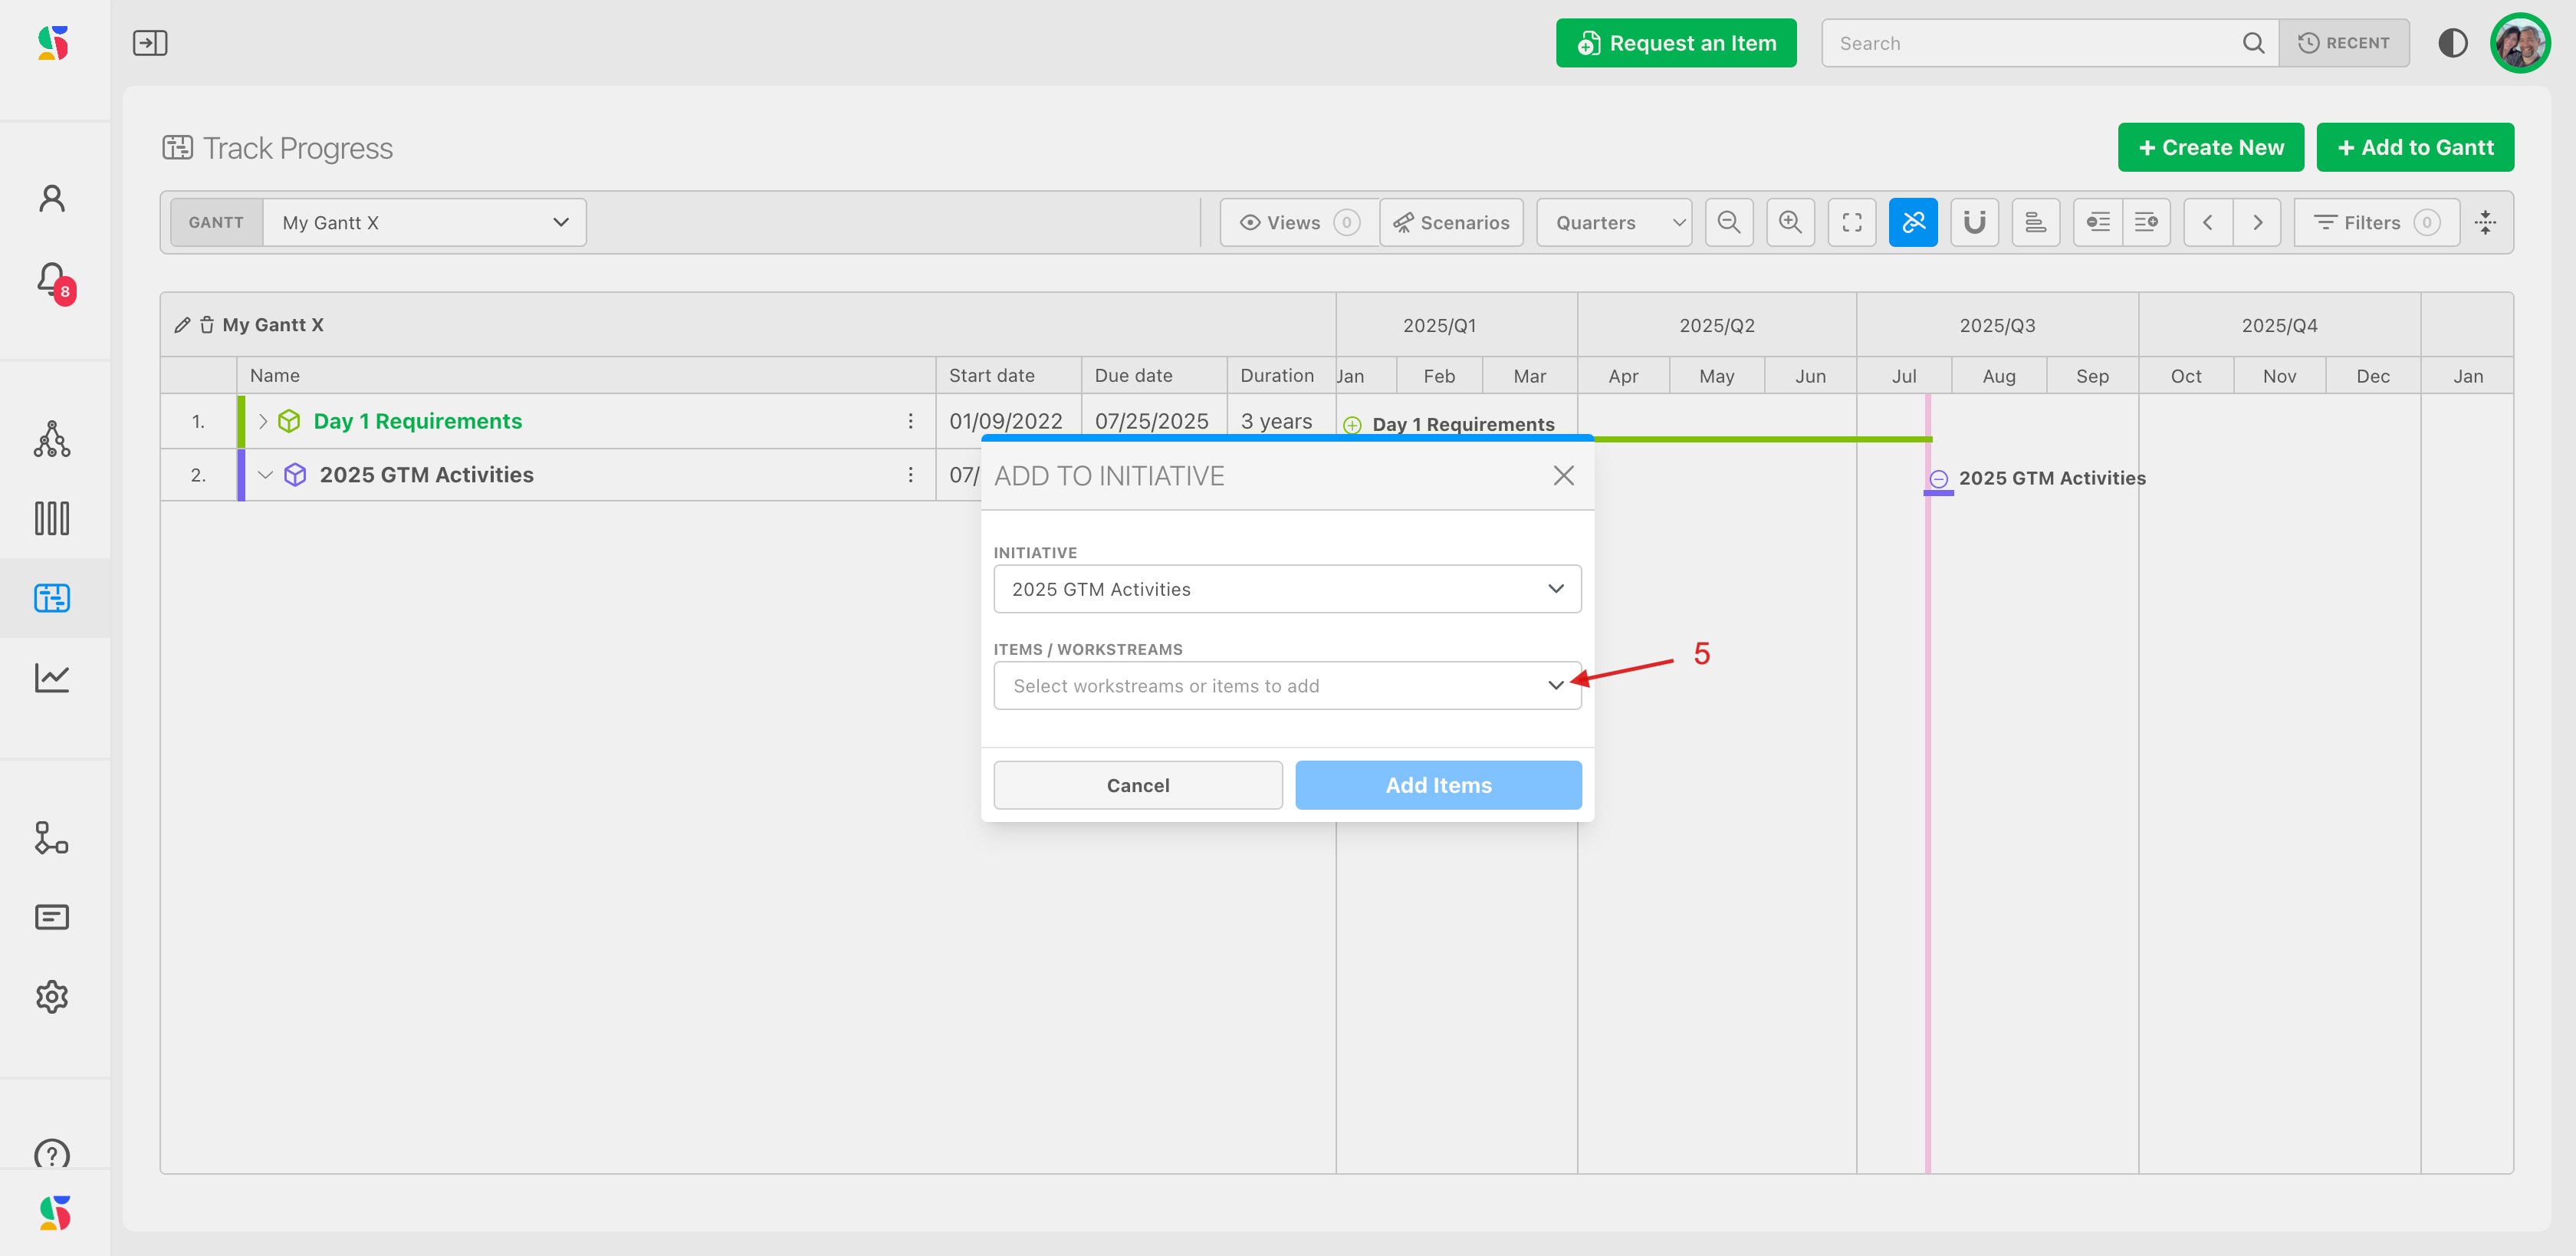
Choose your initiative that you want to add work items to (3).
Then click on the items/workstream dropdown (5).
Use the dialog box to navigate to the items you want to add from your Plan Value workstream map (6):
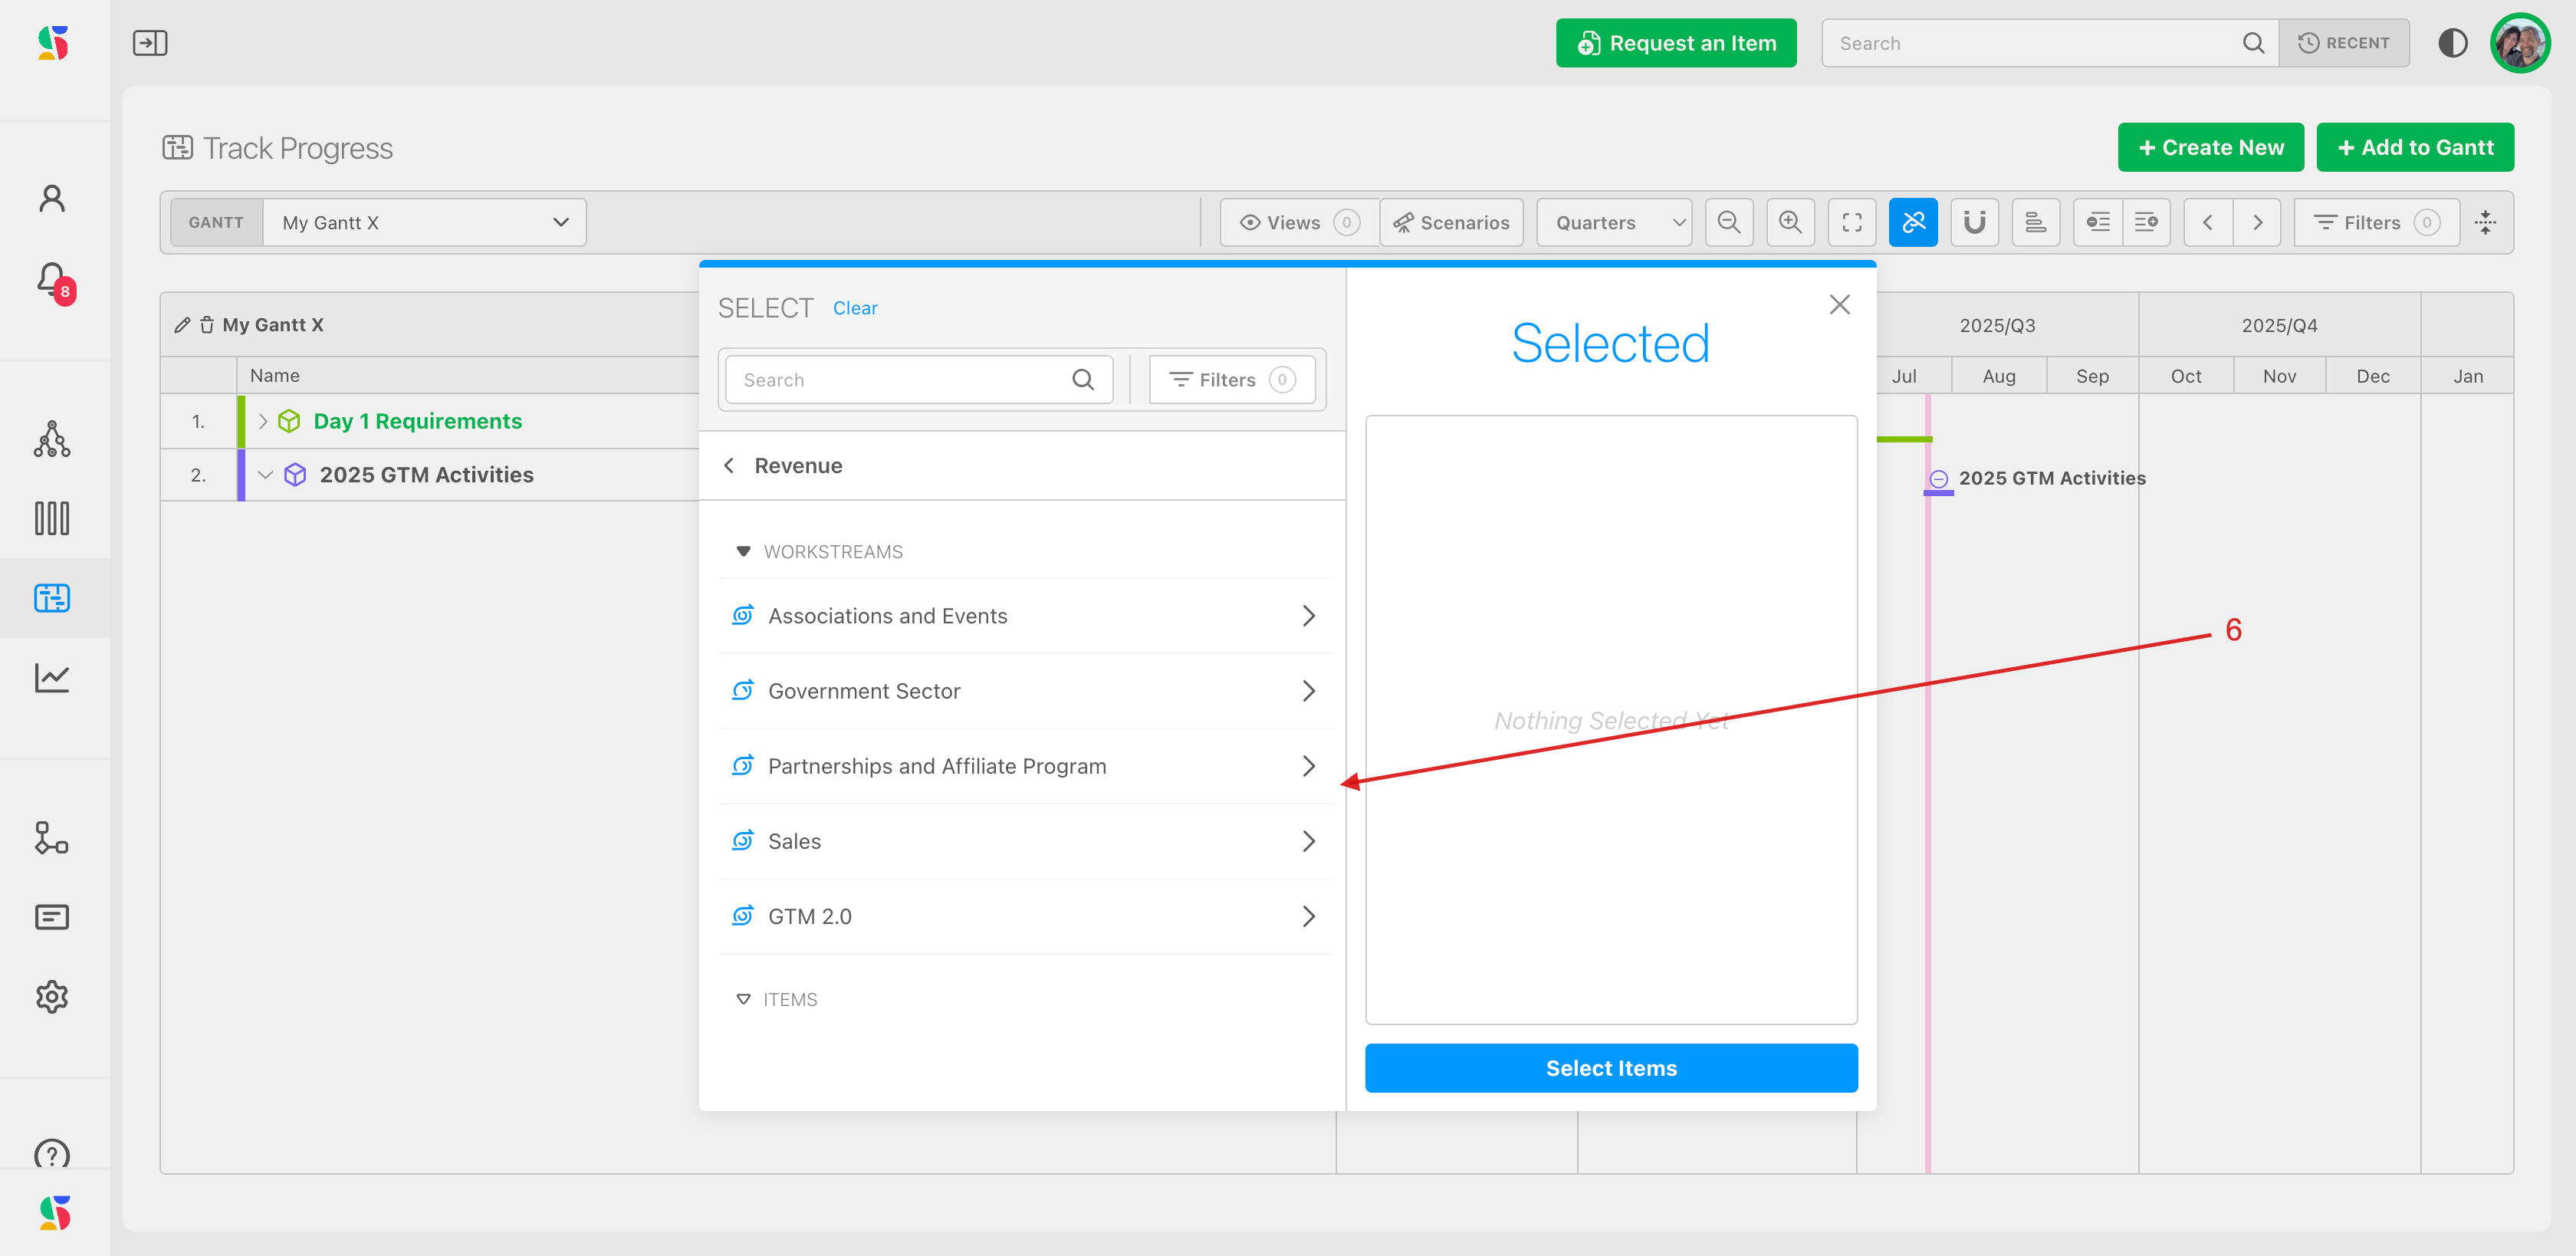
Click to add entire workstreams or individual items to the gantt (7). When you have made your selections, click Select Items (8).
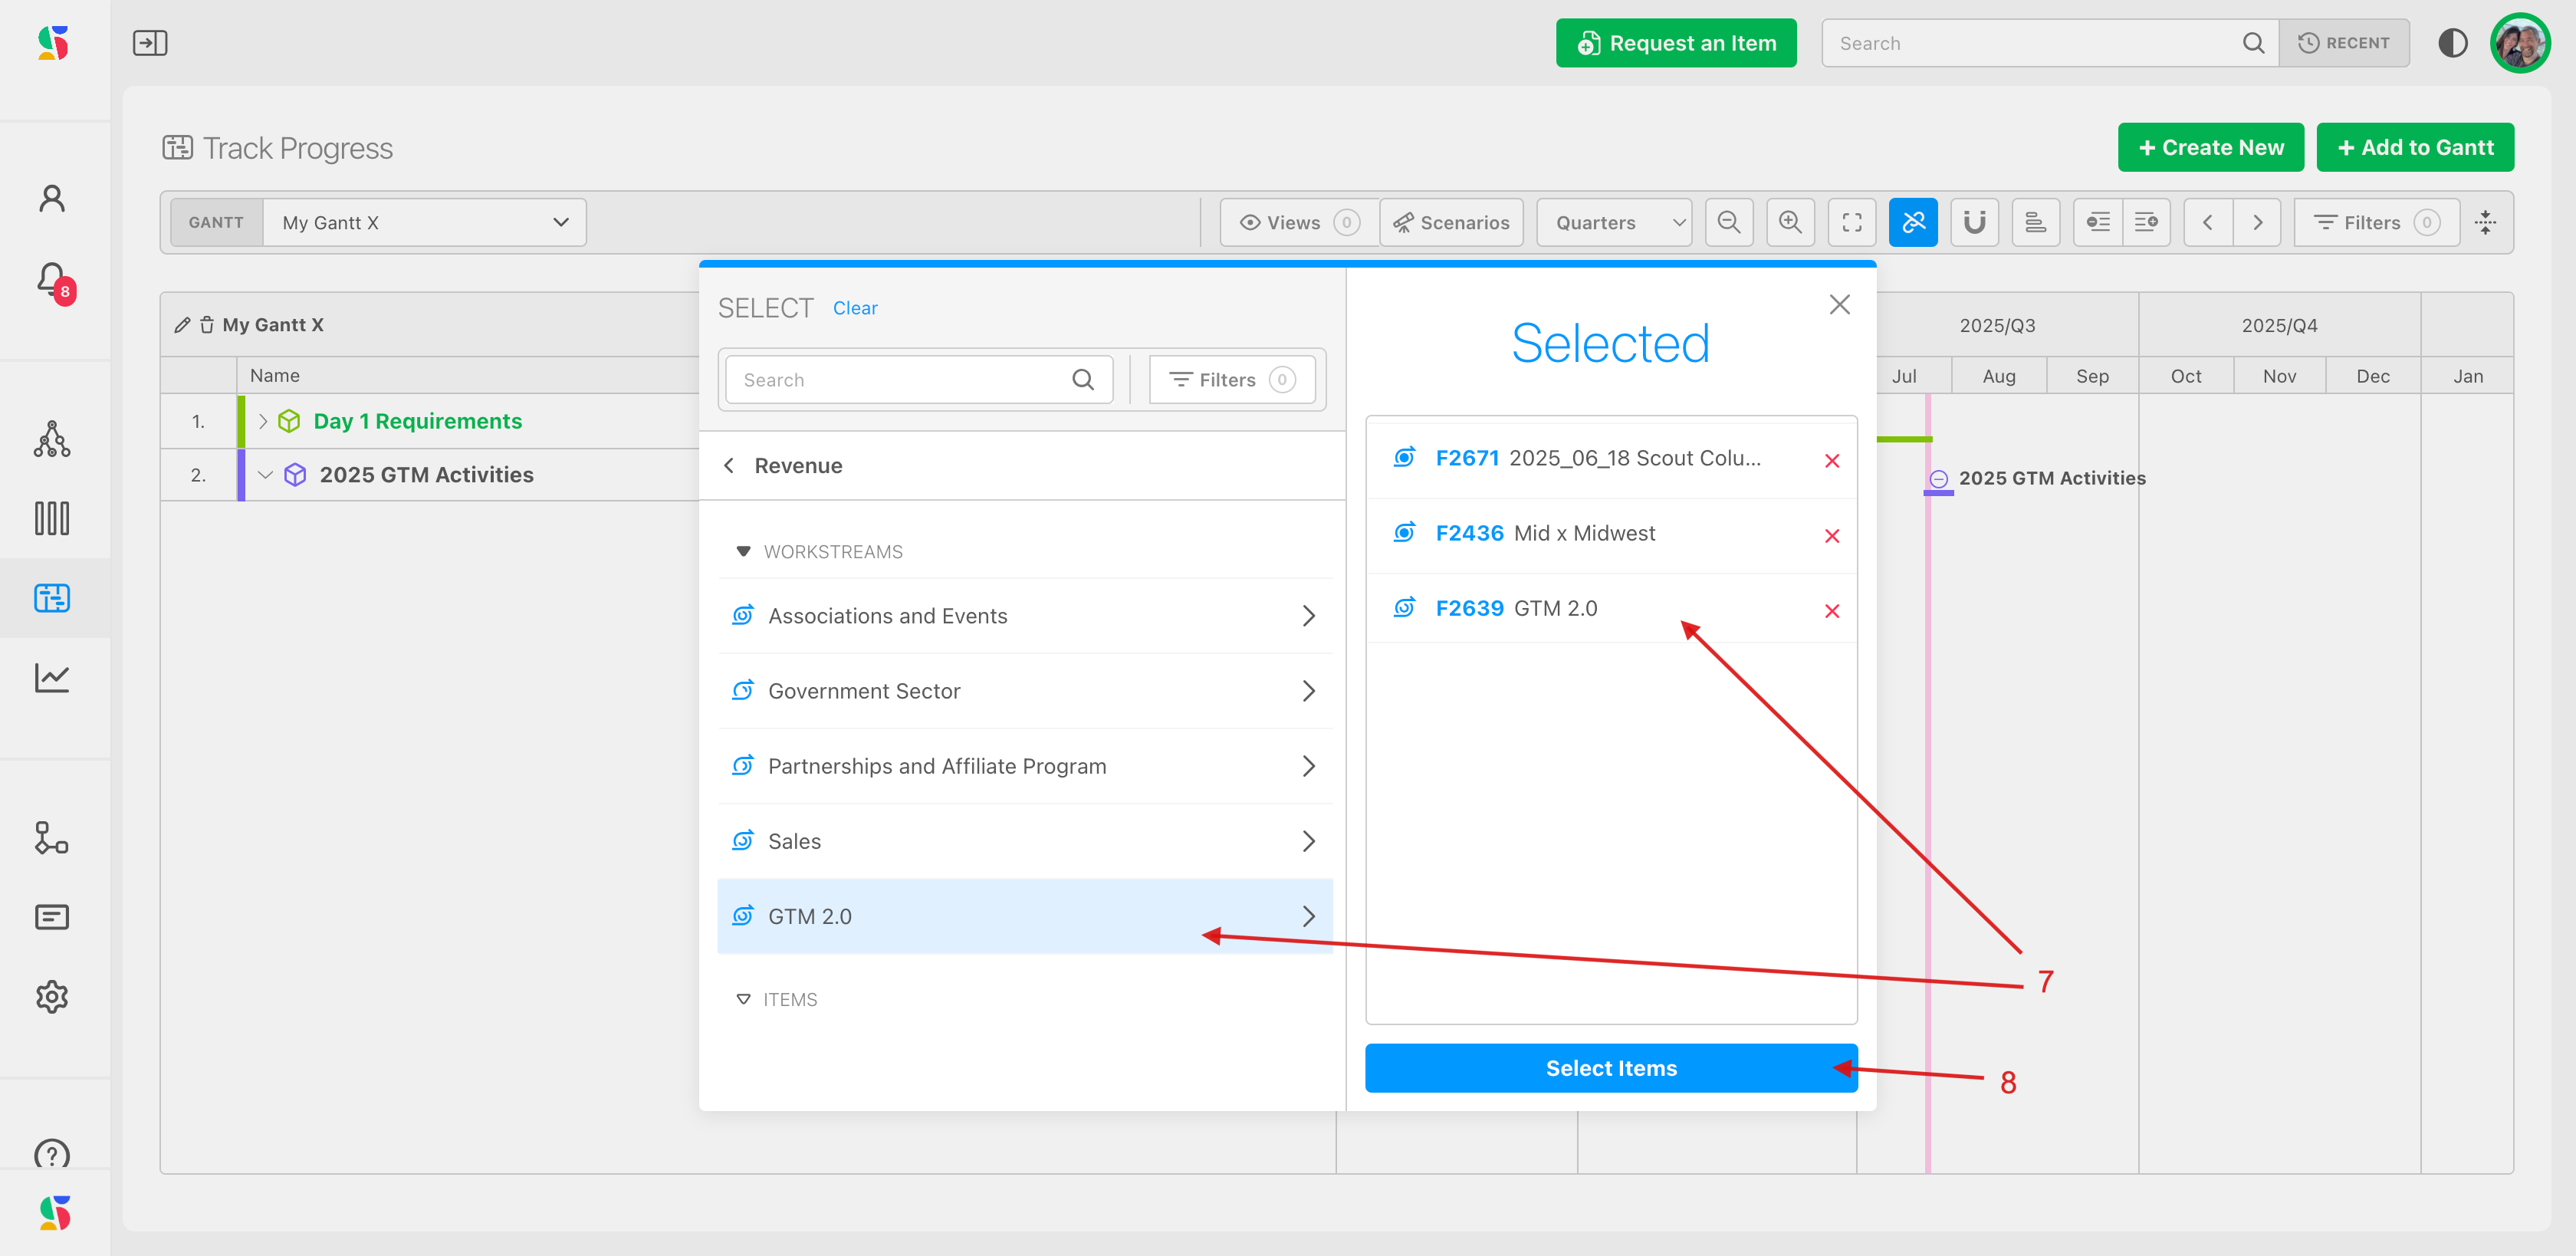
Your gantt can include multiple work from multiple boards, at any level of the value map/workstreams.
Gantt charts render timelines based on the scope and board type of your selection.
If an item lives on a time-boxed board with cadence dates, those dates will automatically populate in the Gantt chart.
If an item lives on a perpetual board, it will appear in the Gantt only if start/end dates are manually assigned.
Step 5: Choose the date granularity you'd like to see
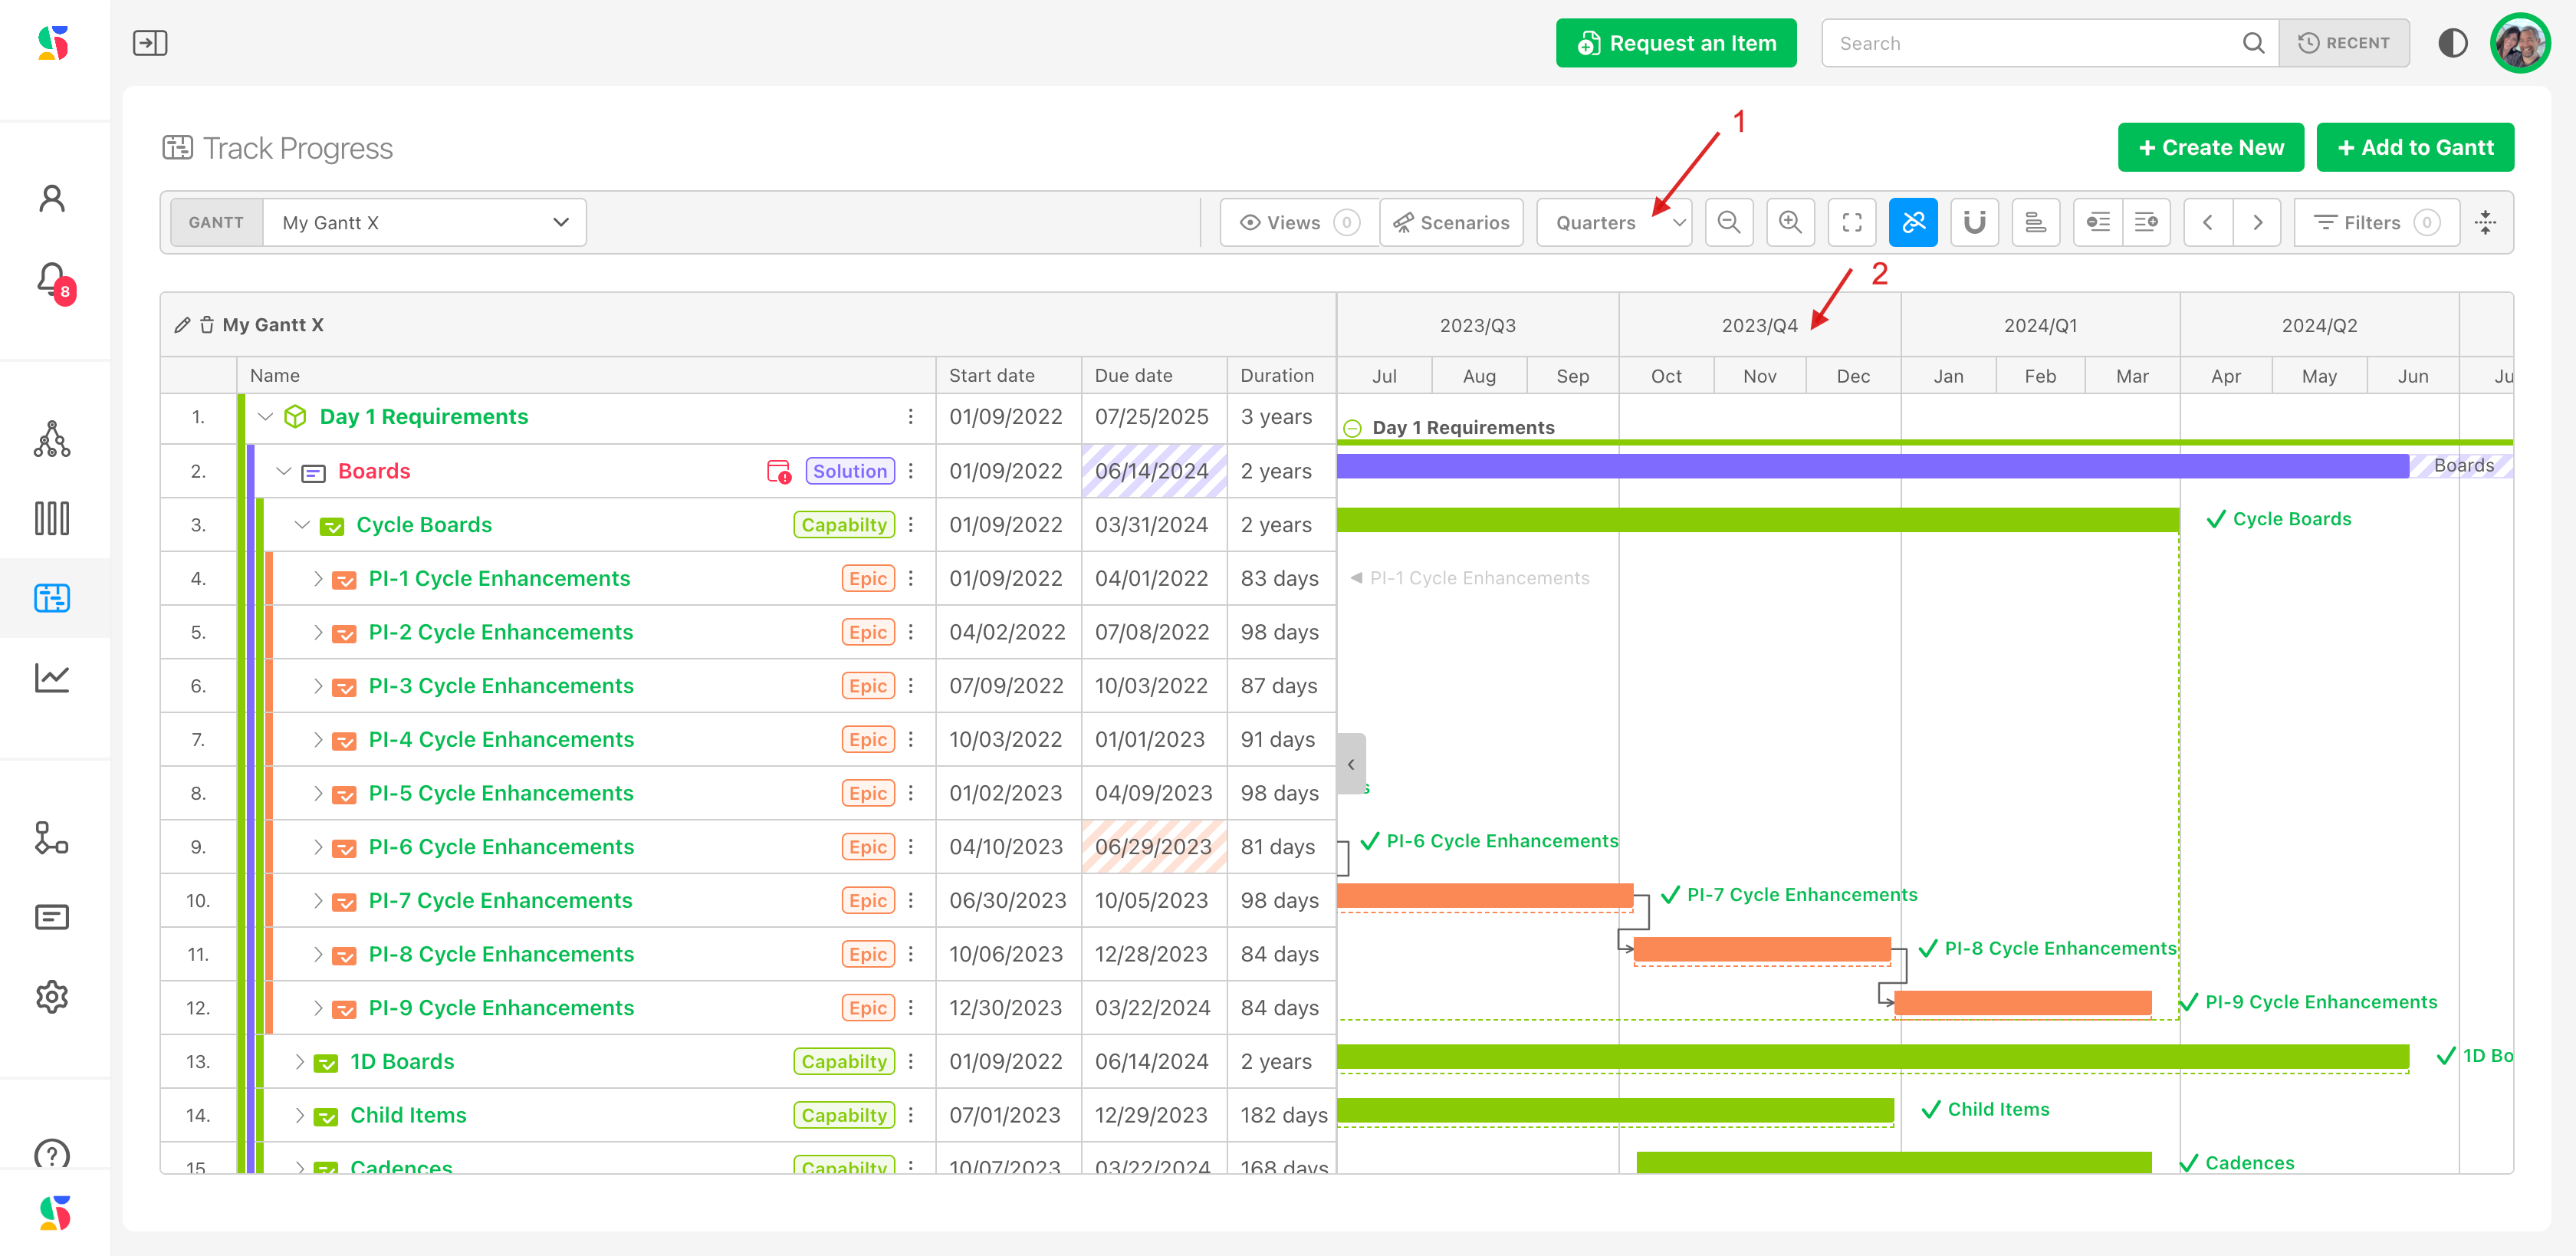
Gantt chart items display on the timeline according to their start and end dates. These dates can be viewed in granularity from days to years. To adjust the granularity, click on the zoom level icon (1) and select the level granularity you'd like to see. The following example displays the quarterly view (2):
Step 6: Associate your gantt chart to your desired cadence: Snap to Cycles
For better date management across cycles, you can map your gantt to a particular board folder and its cadence.
To see these dates through the lens of a particular cadence, you can select the cadence to display in the background on the grid.
Here's how:
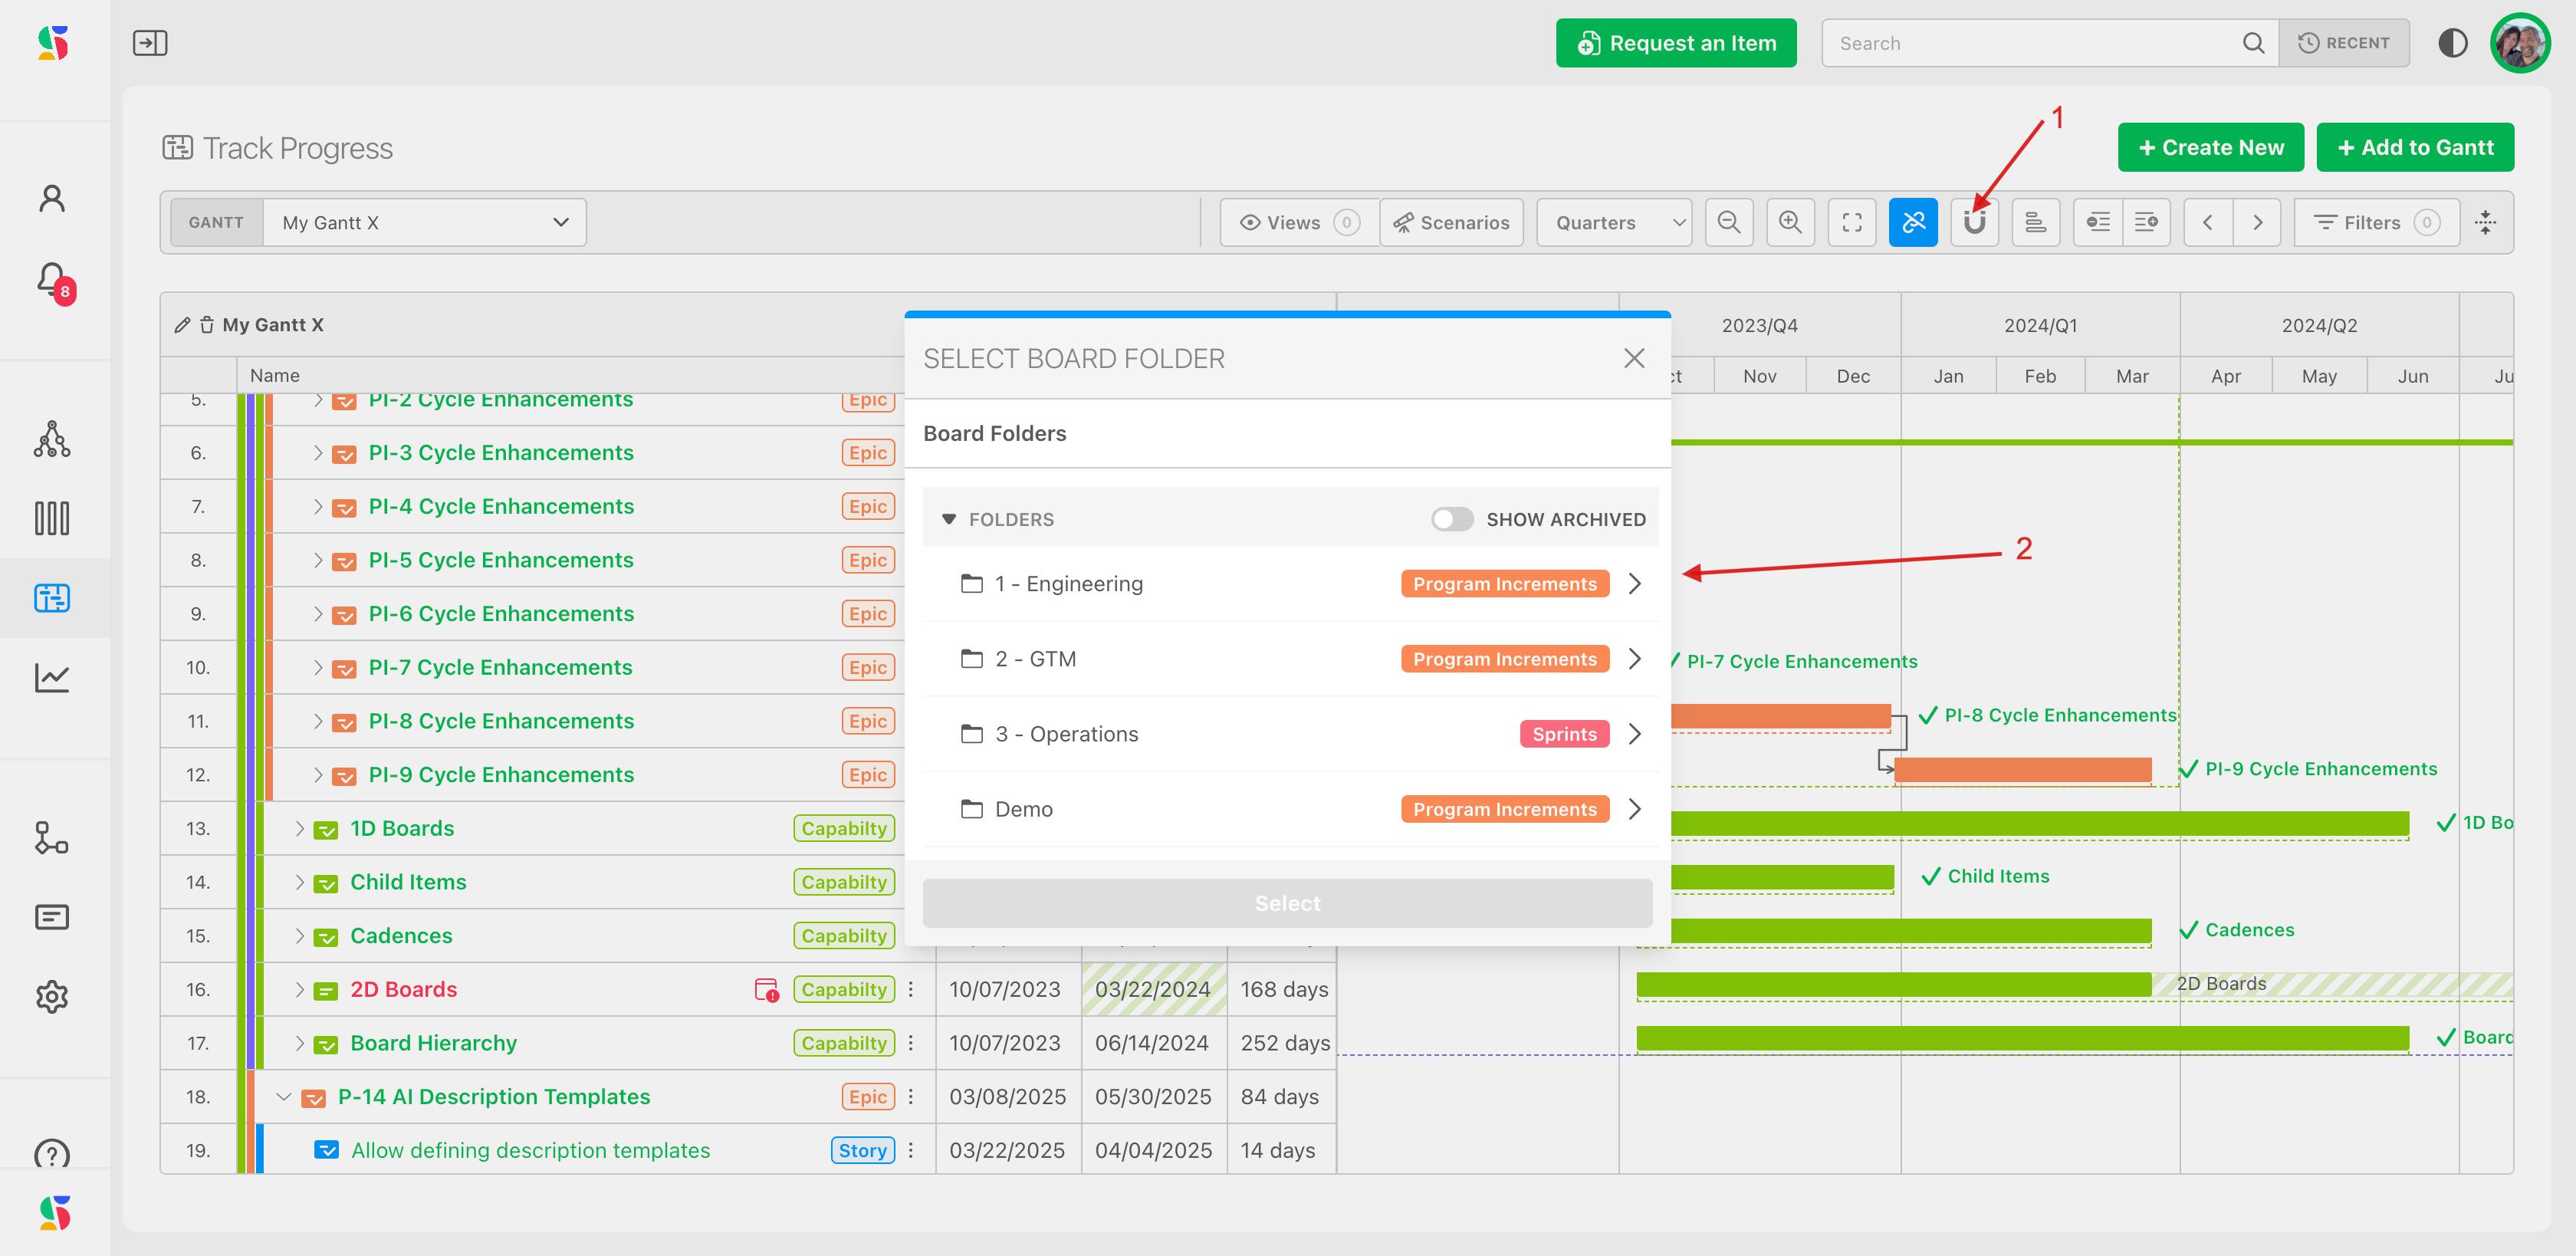
Click the Snap to Cyles icon (1). A modal will appear, indicating the cycles that are used for each board. Navigate to the board that represents the cycle that you wish to use (2):
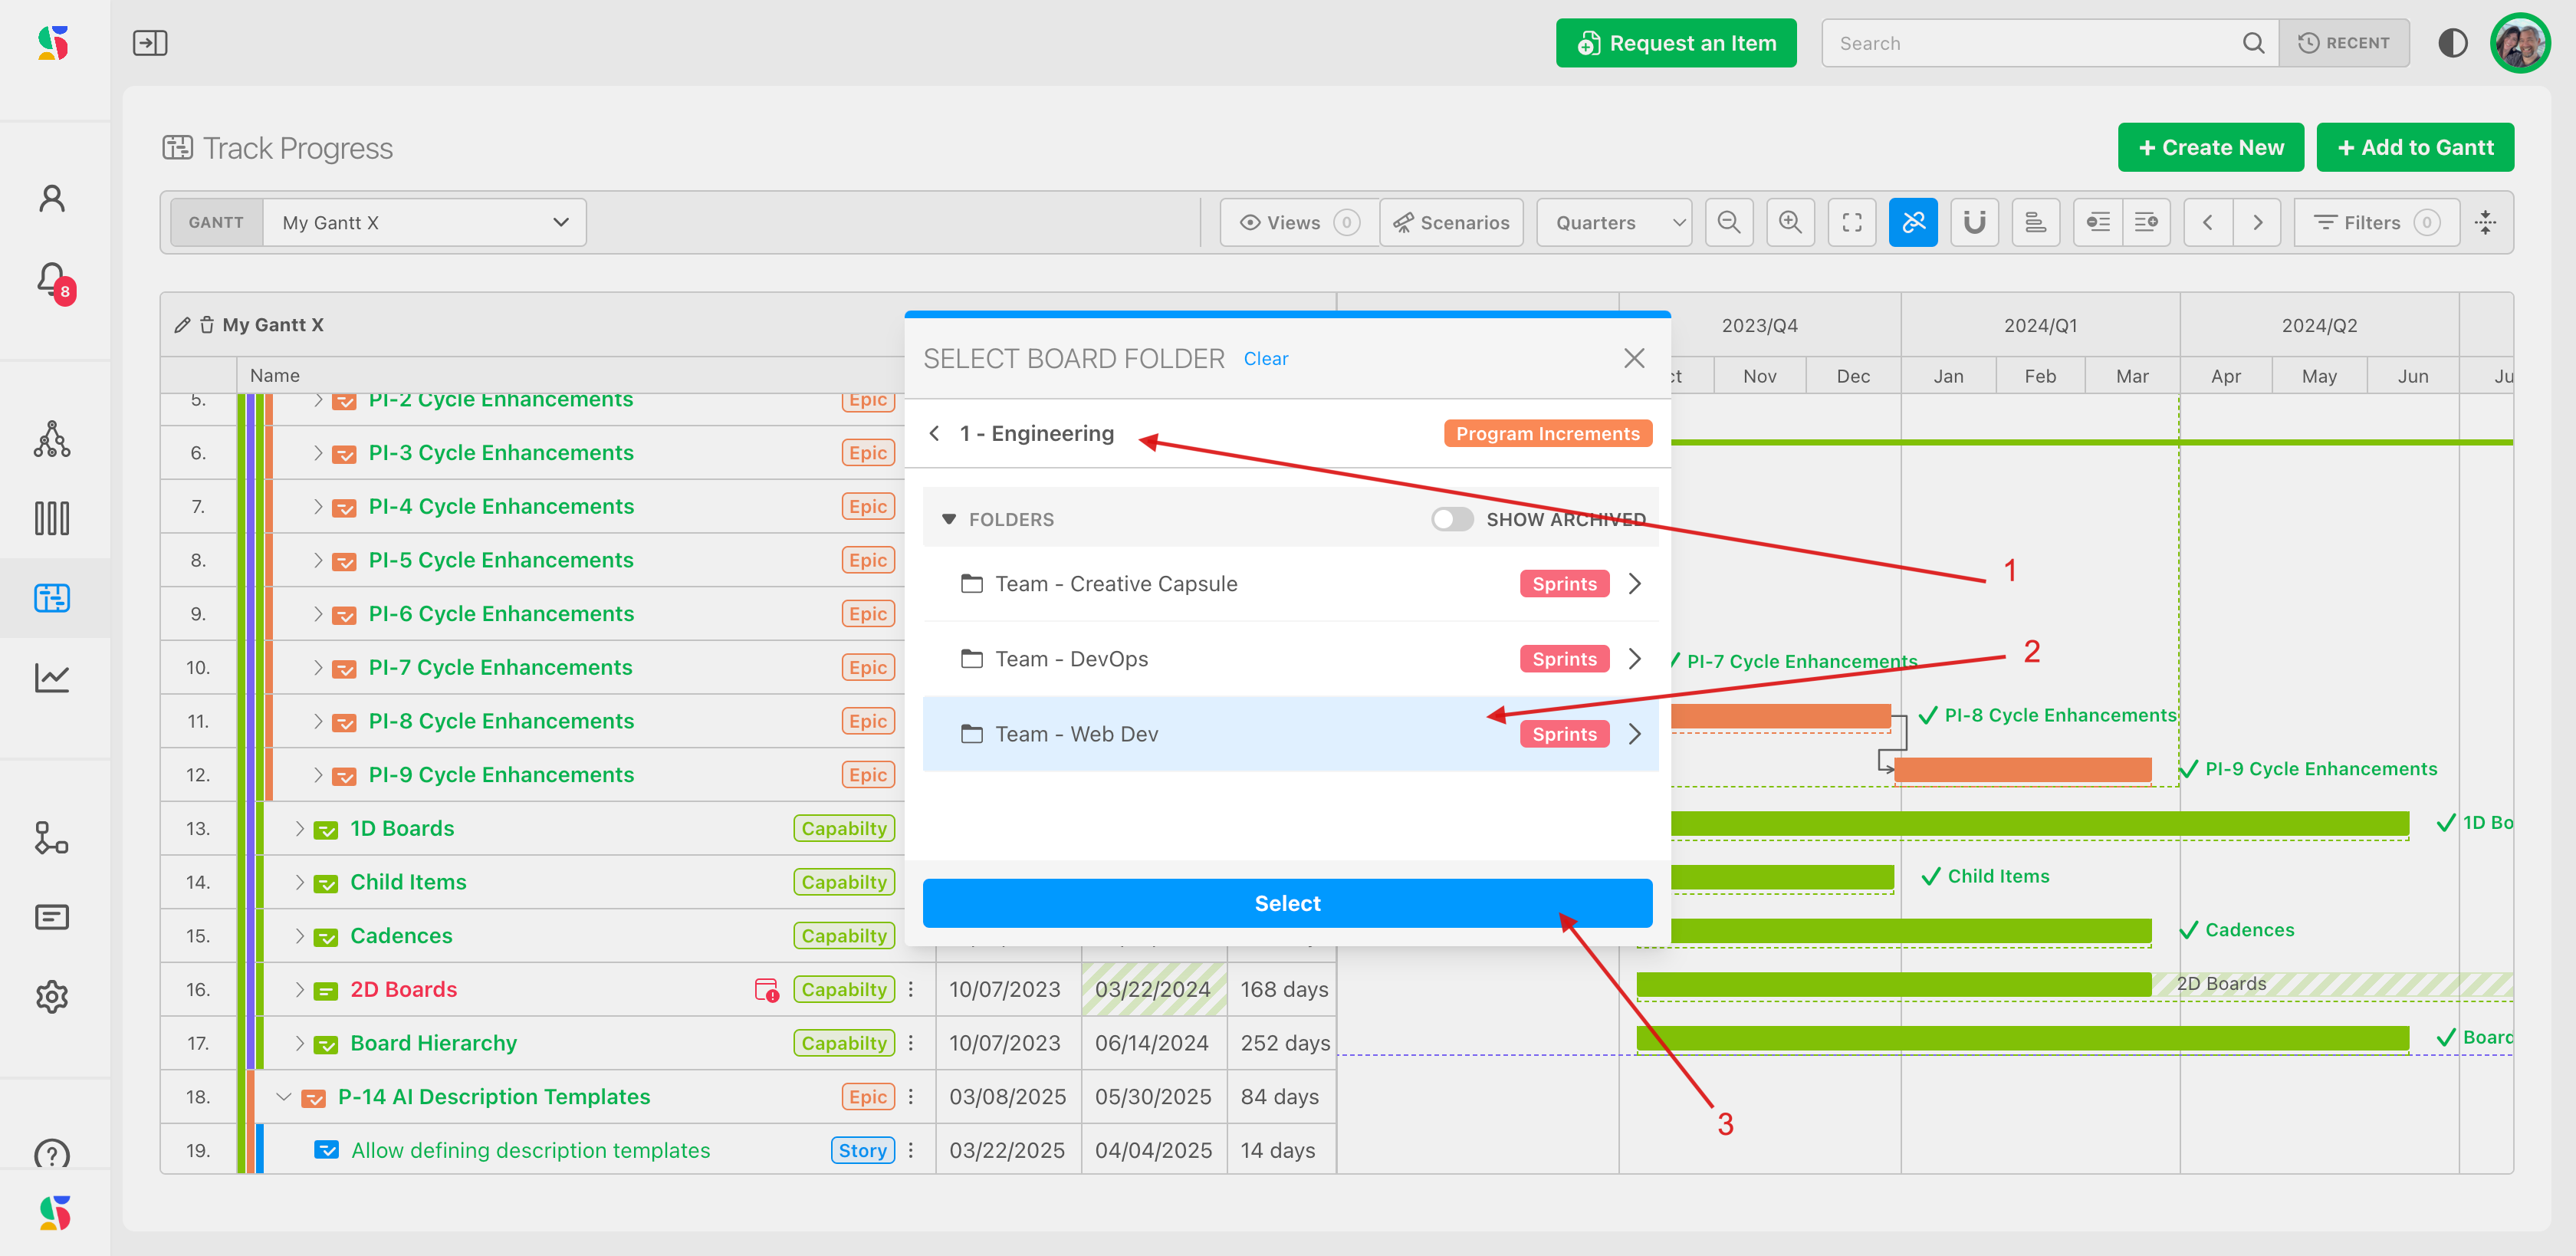
In the example below, we want to see the gantt chart through the lens of the Engineering (1) - Web Dev team's board. Note that they work in "Sprints" (2):
Once you navigate to the board cycle you want, click Select (3).
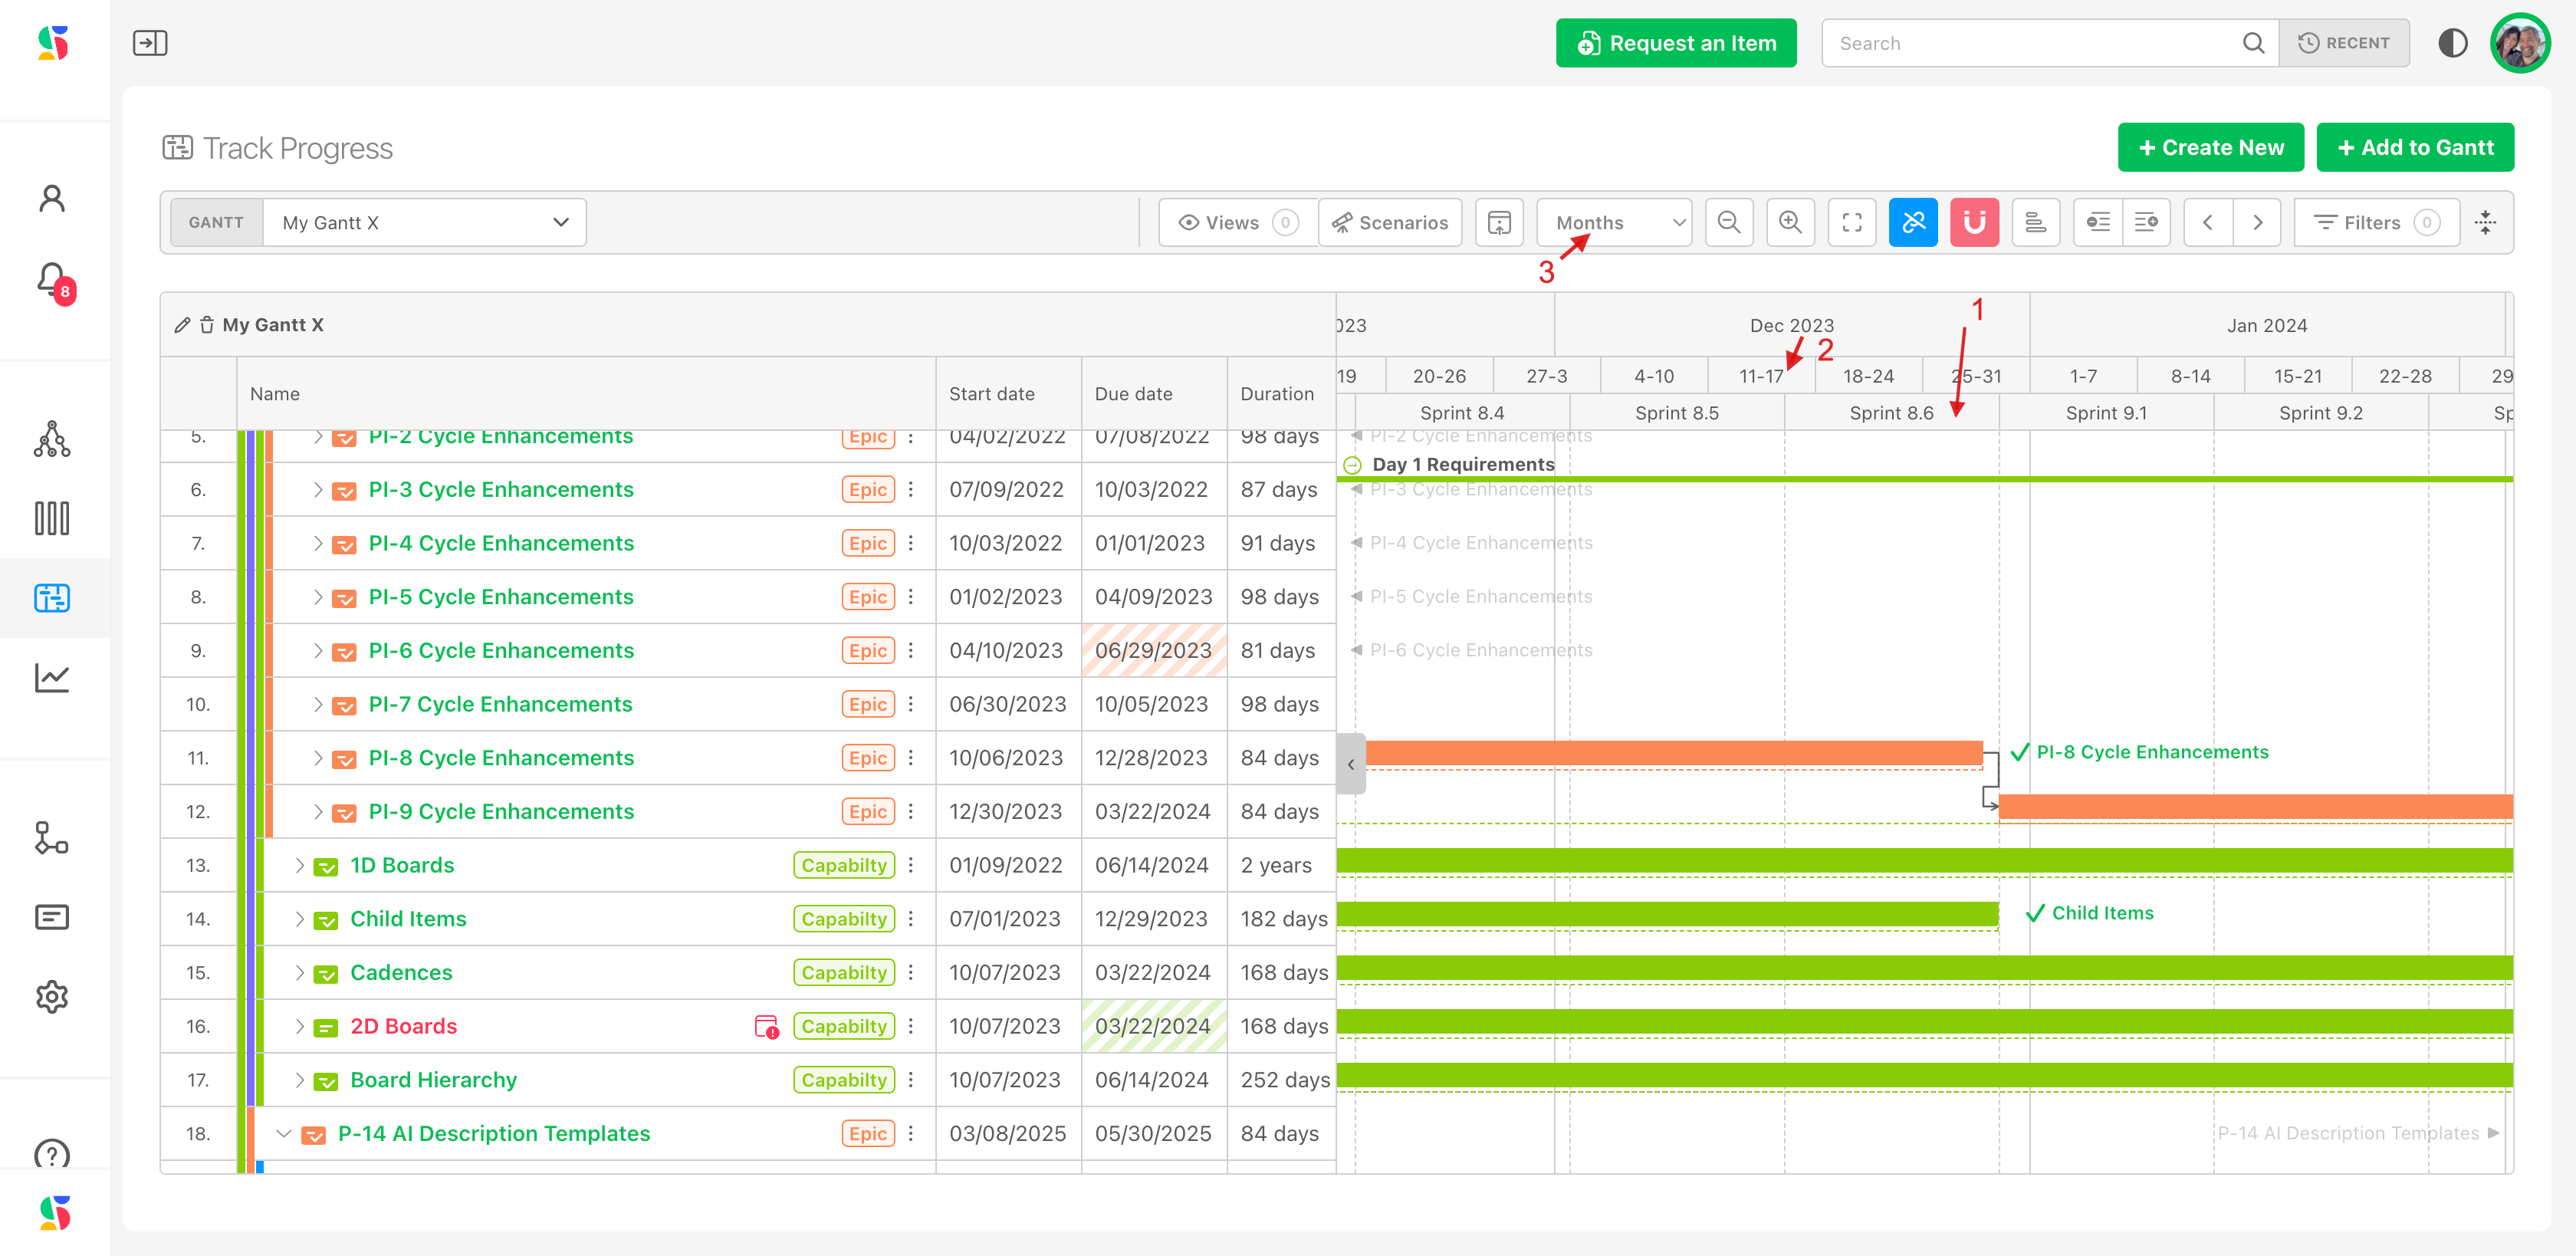
The sprint cycle for this team now appears on the gantt chart grid. Note the sprint name is listed (1) and the timeframe displays (2) according to the level of granularity selected (3).
Here, we have selected the calendar to display in months now instead of quarters because we want to see our sprints by months:
Next Up: Using Gantts
Why it Matters
While the name of the game is agility, dates matter most to clients. If you’re accountable for date commitments, contractual, financial, or regulatory outcomes, DevStride helps you build confidence and reduce delivery risks.
:::
Was this article helpful?