Using Gantt Charts: Navigating the timeline
- 08 Aug 2025
- 4 Minutes to read
- Contributors

- Print
- DarkLight
Using Gantt Charts: Navigating the timeline
- Updated on 08 Aug 2025
- 4 Minutes to read
- Contributors
- Print
- DarkLight
Article summary
Did you find this summary helpful?
Thank you for your feedback!
Overview
Gantt charts provide a clear picture of items, their timeline, their completion status, teams and dependencies.
But there is even more you can do using DevStride's powerful gantt charts by interacting with the visual timeline.
Read on to learn more about:
- moving dates and adjusting the timelines
- snapping to cycles
- interacting with relationship mapping
Move dates
DevStride's gantt chart is integrated with all other modules. That means that changing dates and timeframes in the gantt chart also updates dates and timeframes in the items themselves.
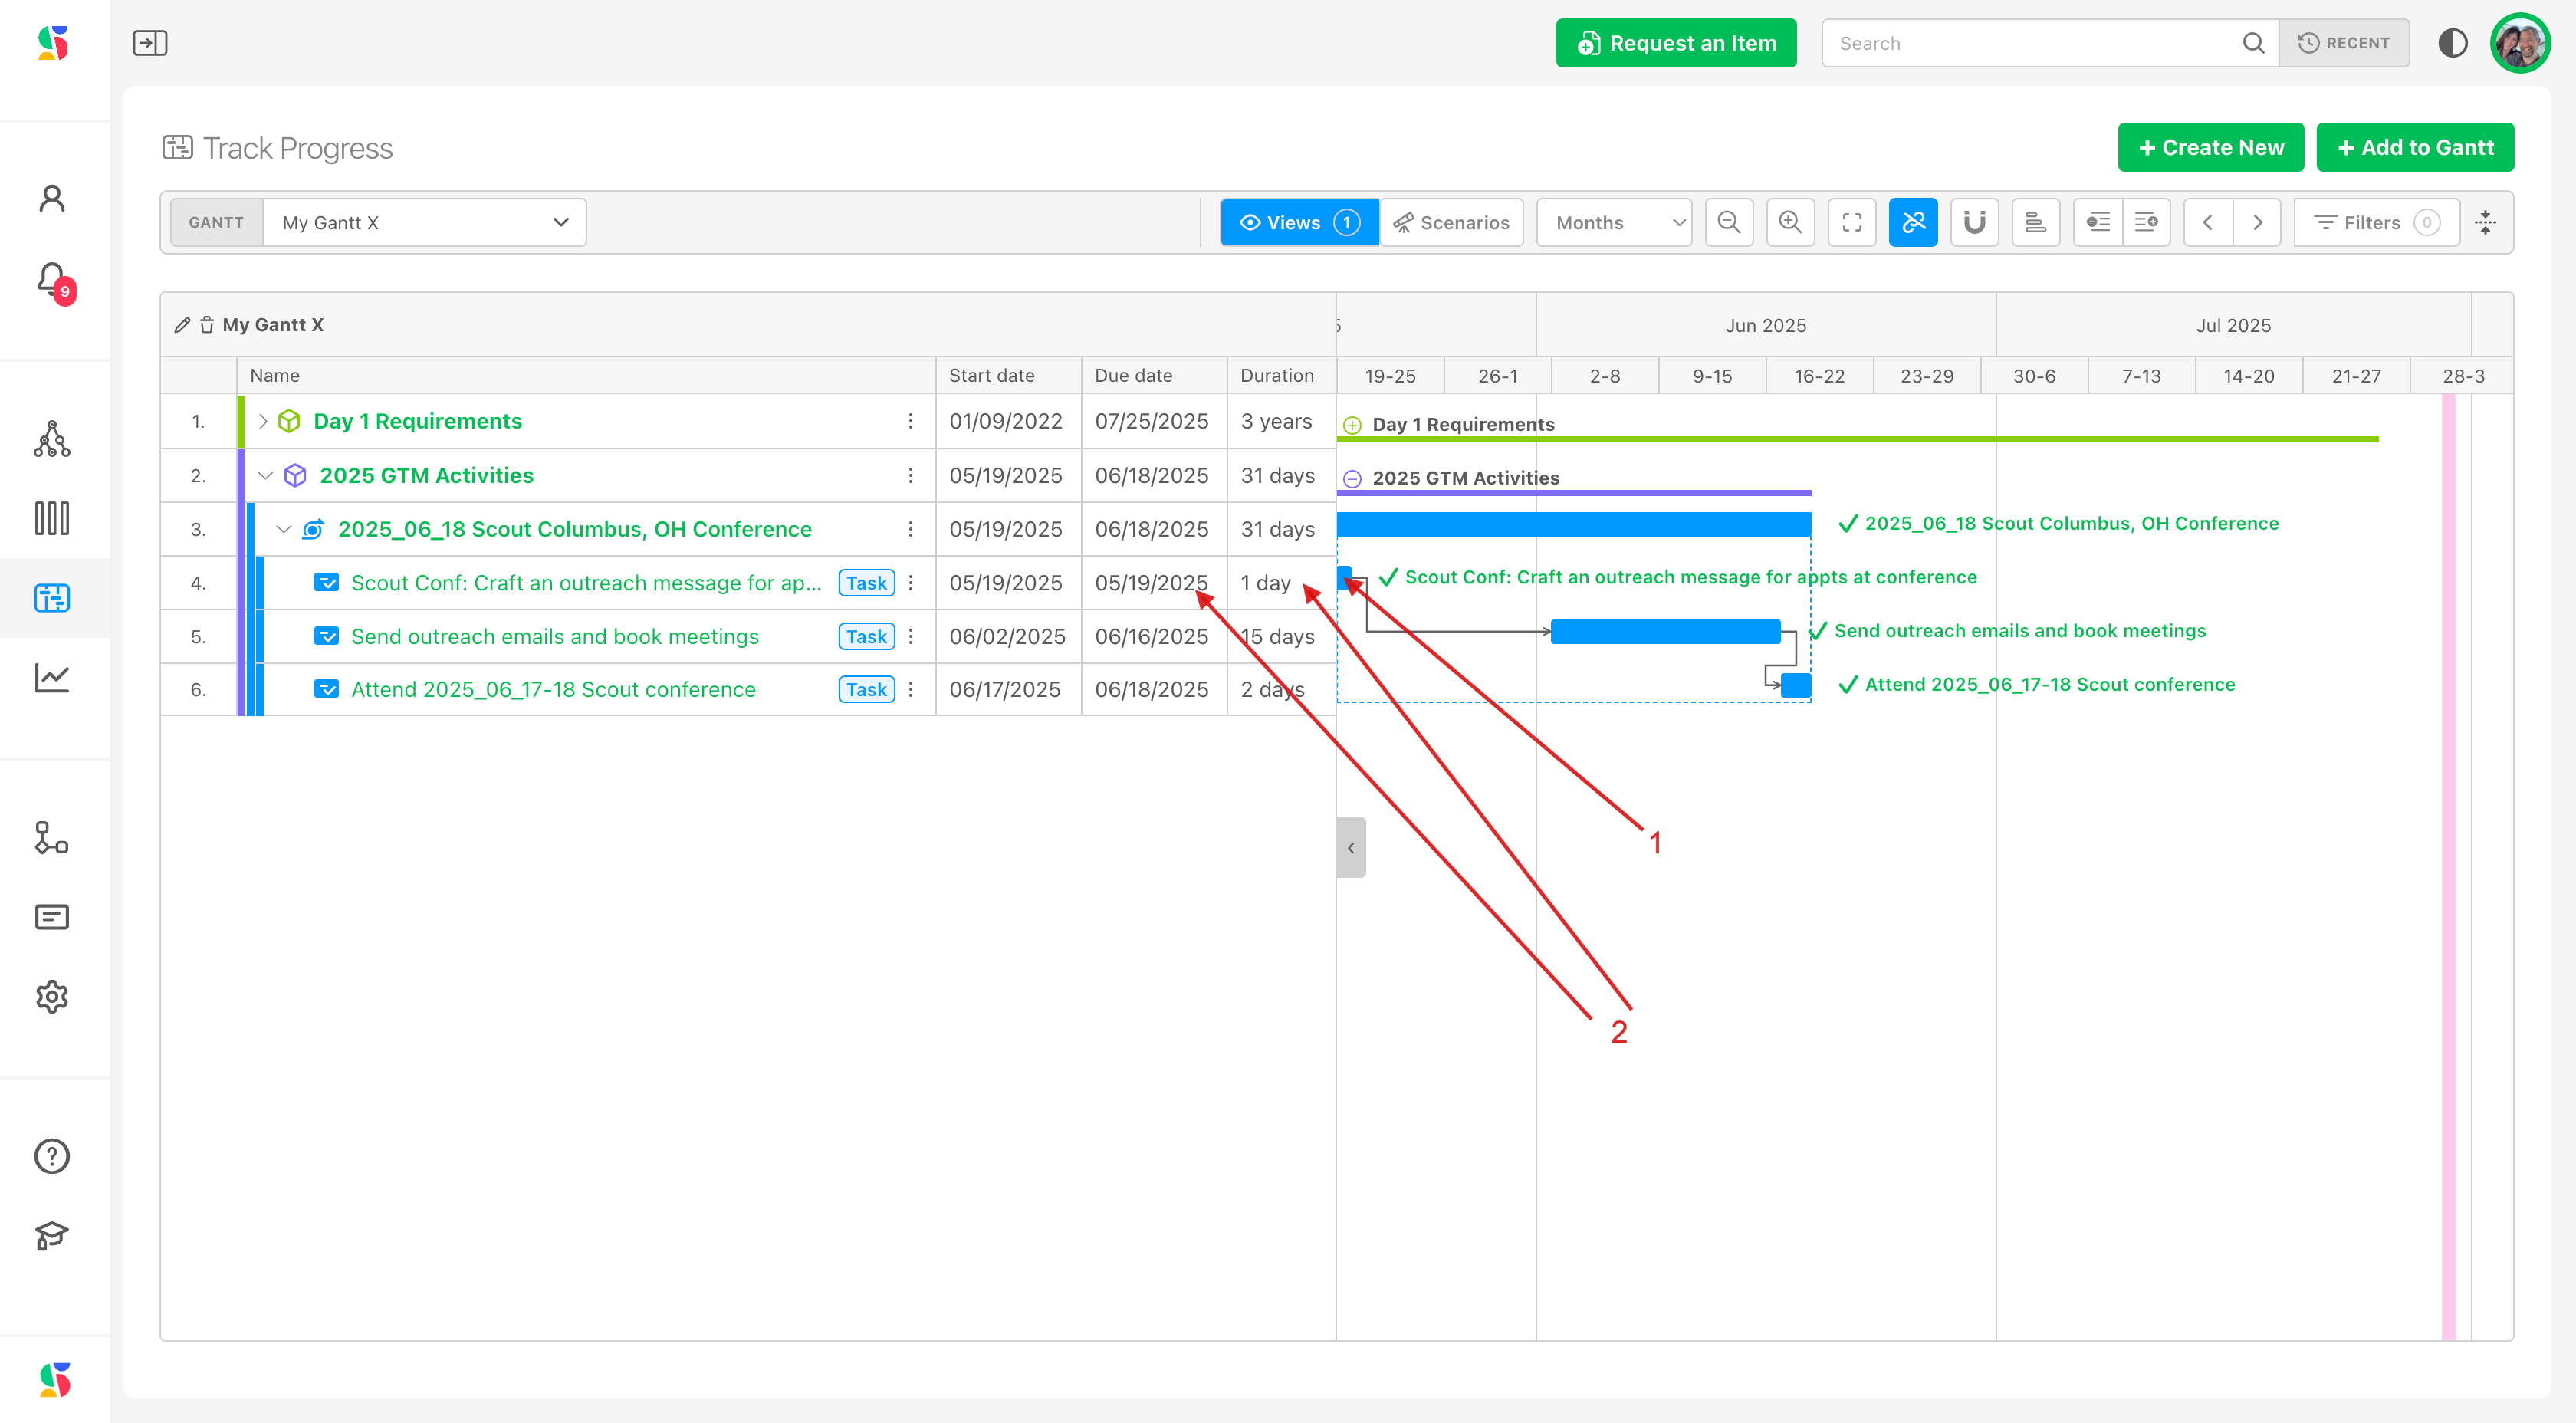
Step 1. Adjust the timeline by moving the timeline bar
Click on the progress bar for the task you would like to adjust (1). Note the details in the left pane (2) for the the task we are going to change. The due date is currently set for 5/19/25 and is 1 day in duration.
Drag on the progress bar (3) to adjust the dates and/or duration of the task. You can also reference the calendar dates on your table view in the left pane (4). In this example, we have changed the task duration from 1 day to 9 days, which updates the duration displayed on the left side of the pane as well.
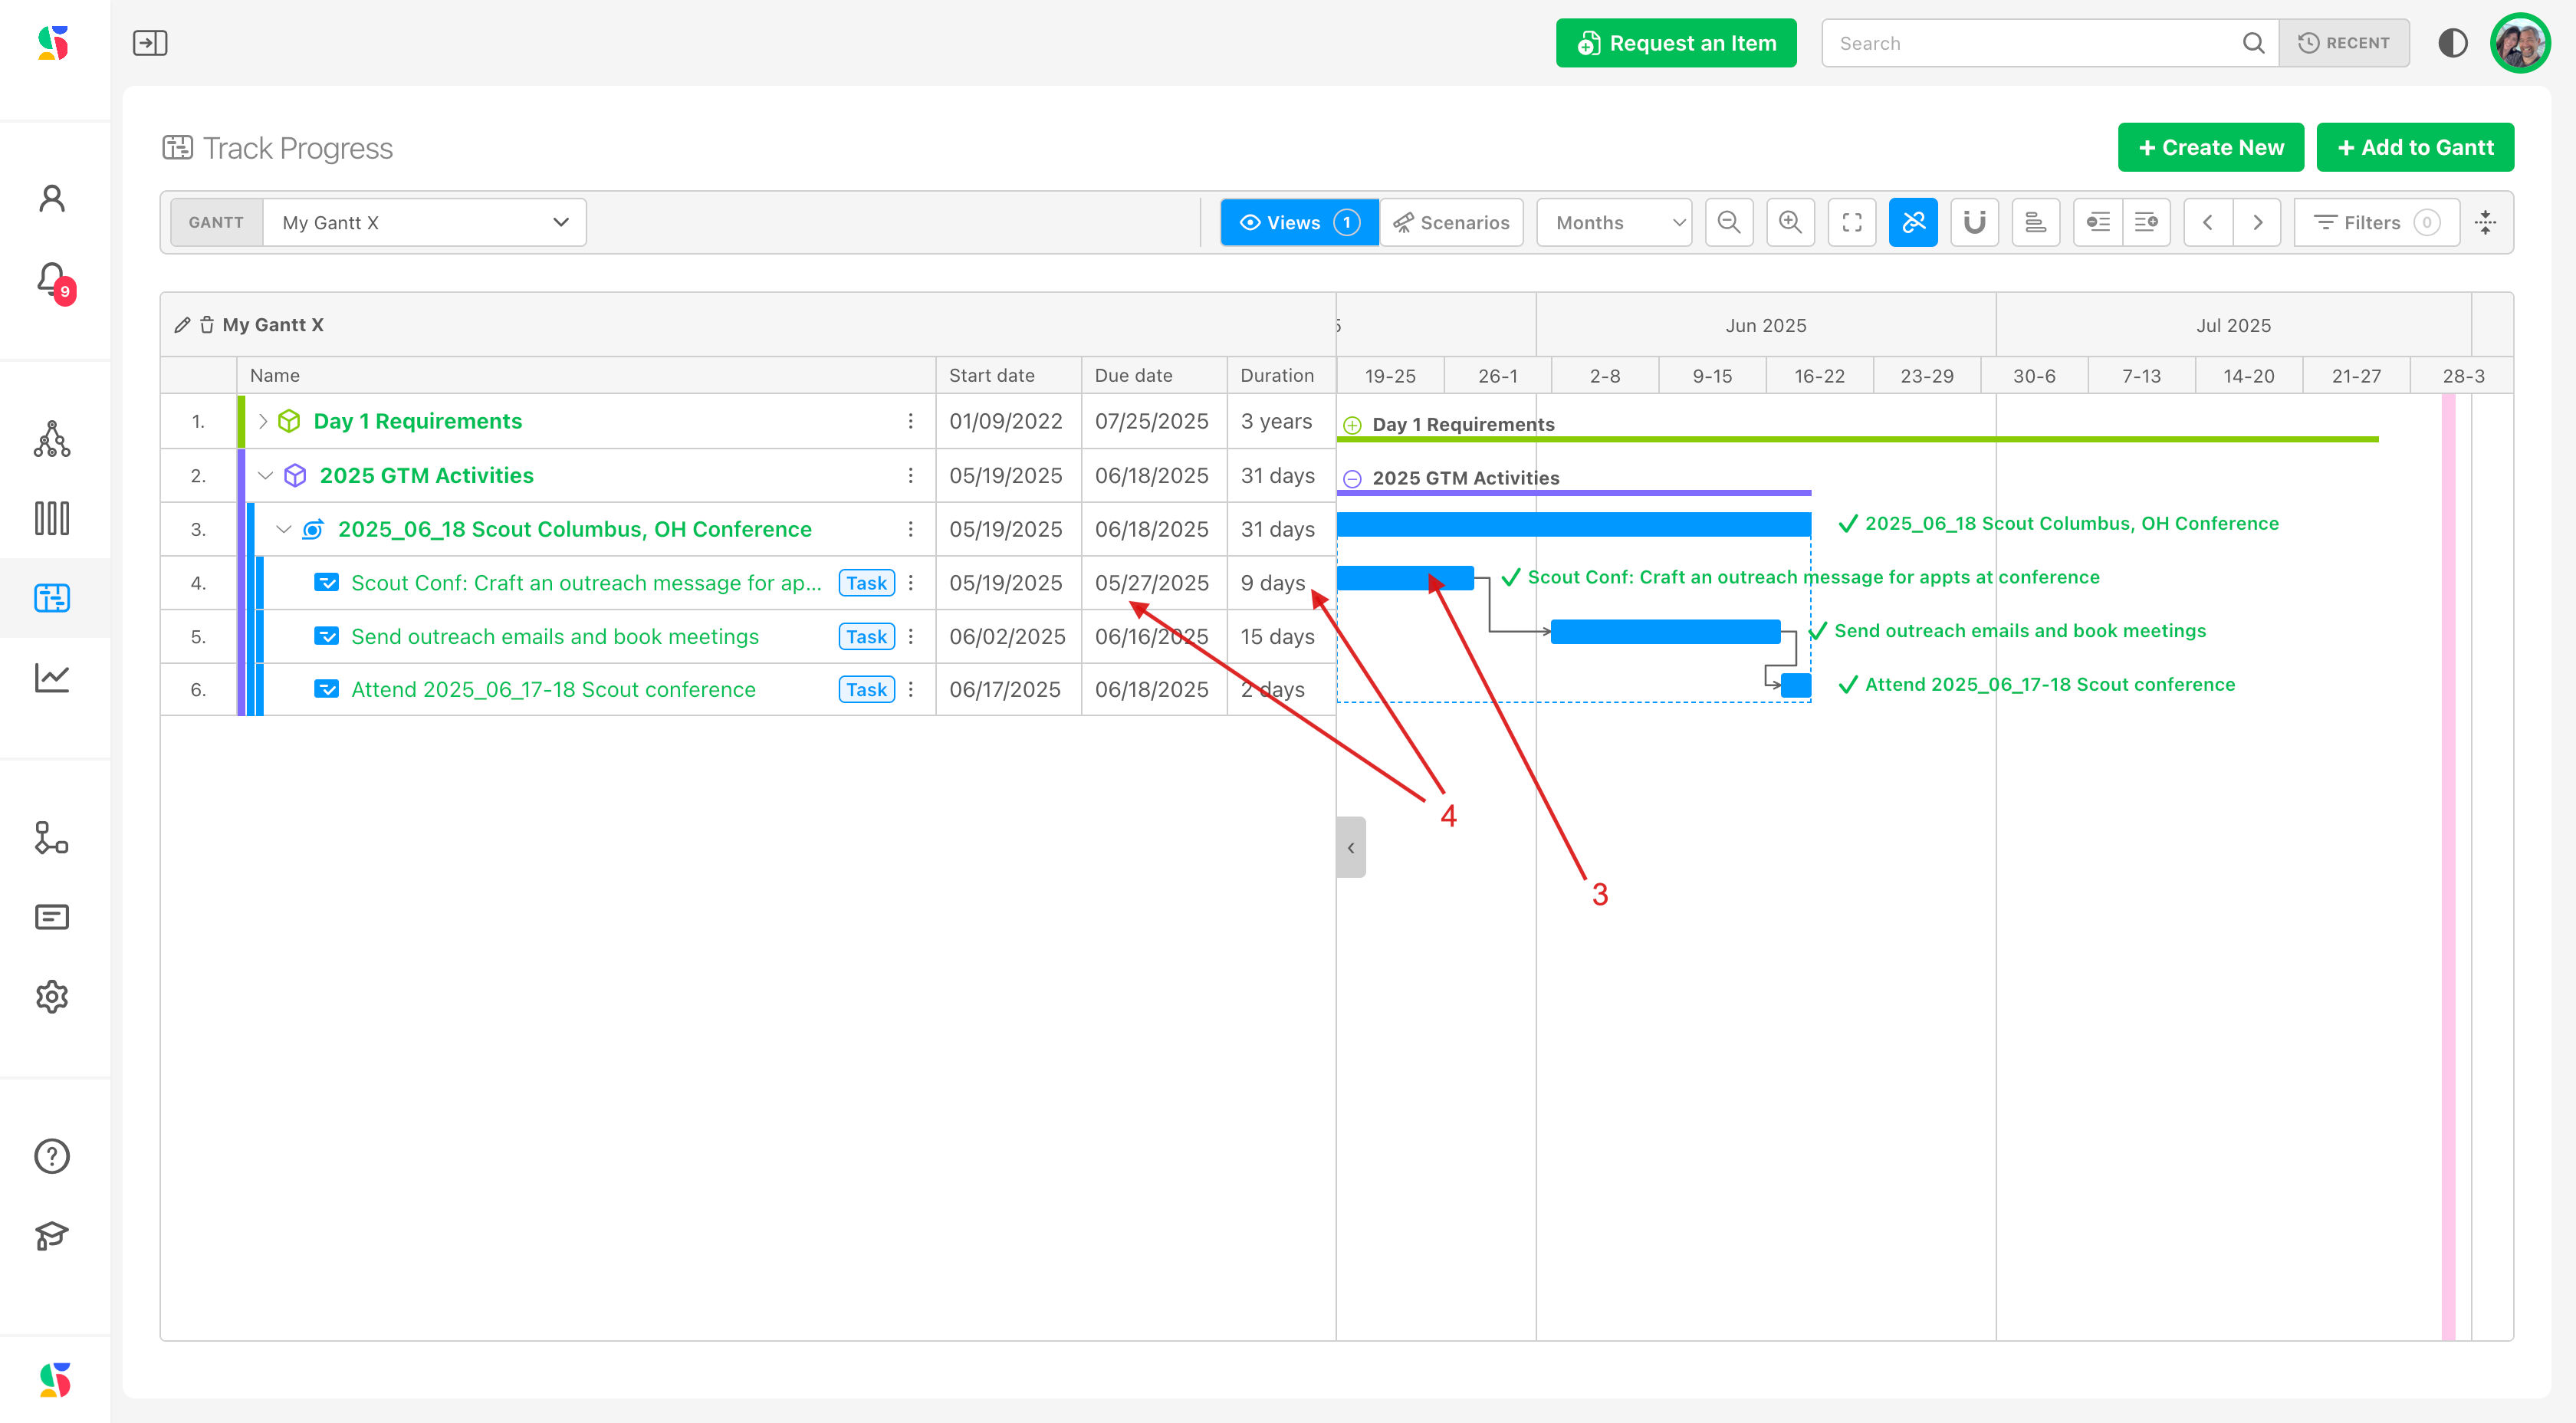
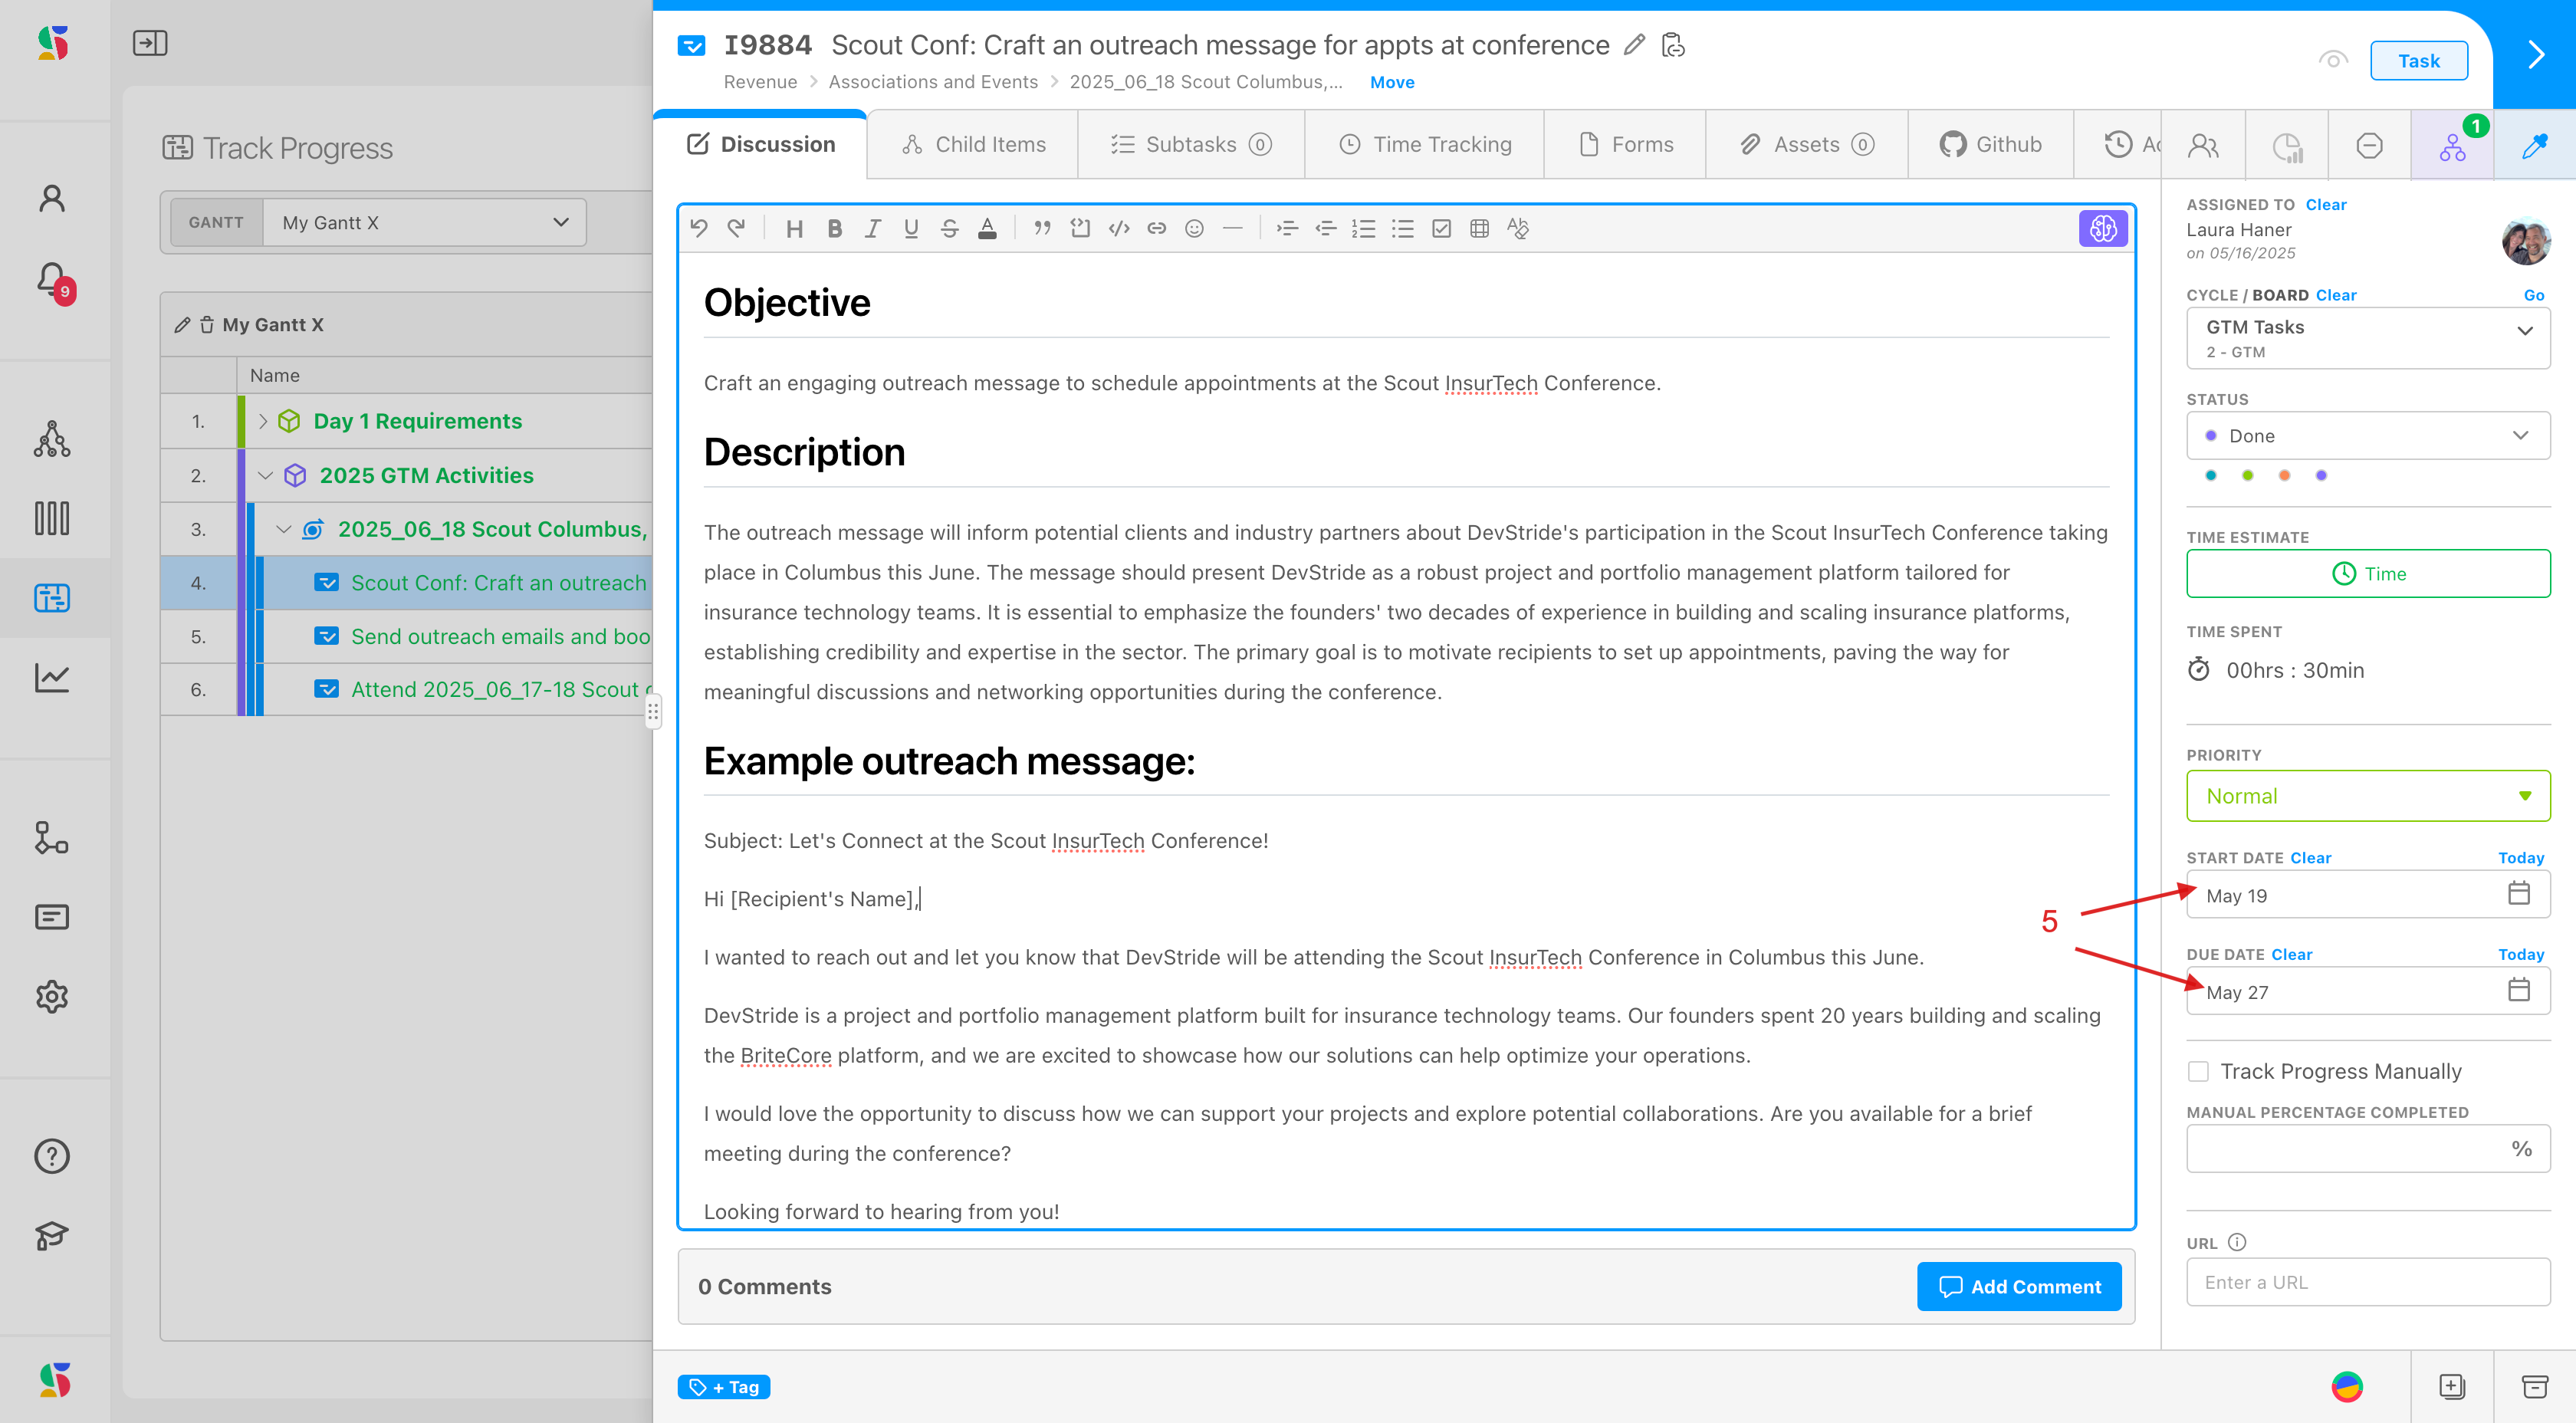
Note that changing the duration here, also changes duration dates in the item itself (5).
Step 2: Snap to Cycle, if desired
DevStride allows you to easily adjust dates that are in line with the cadence you use.
By clicking on the Snap to Cycles icon (1) you can map your gantt chart to any folder to adopt a specific cycle for better date management. Note that on this example, 2 week cycles currently display (2).
To map to a specific board or change to a different board, click on the Snap to Cycles icon.
A modal pops up (3) that allows you to select the cycles you want to view your gantt in. You can choose to associate the items in your gantt with your working group folder's cycle OR you can choose to view the items through the lens of another team.
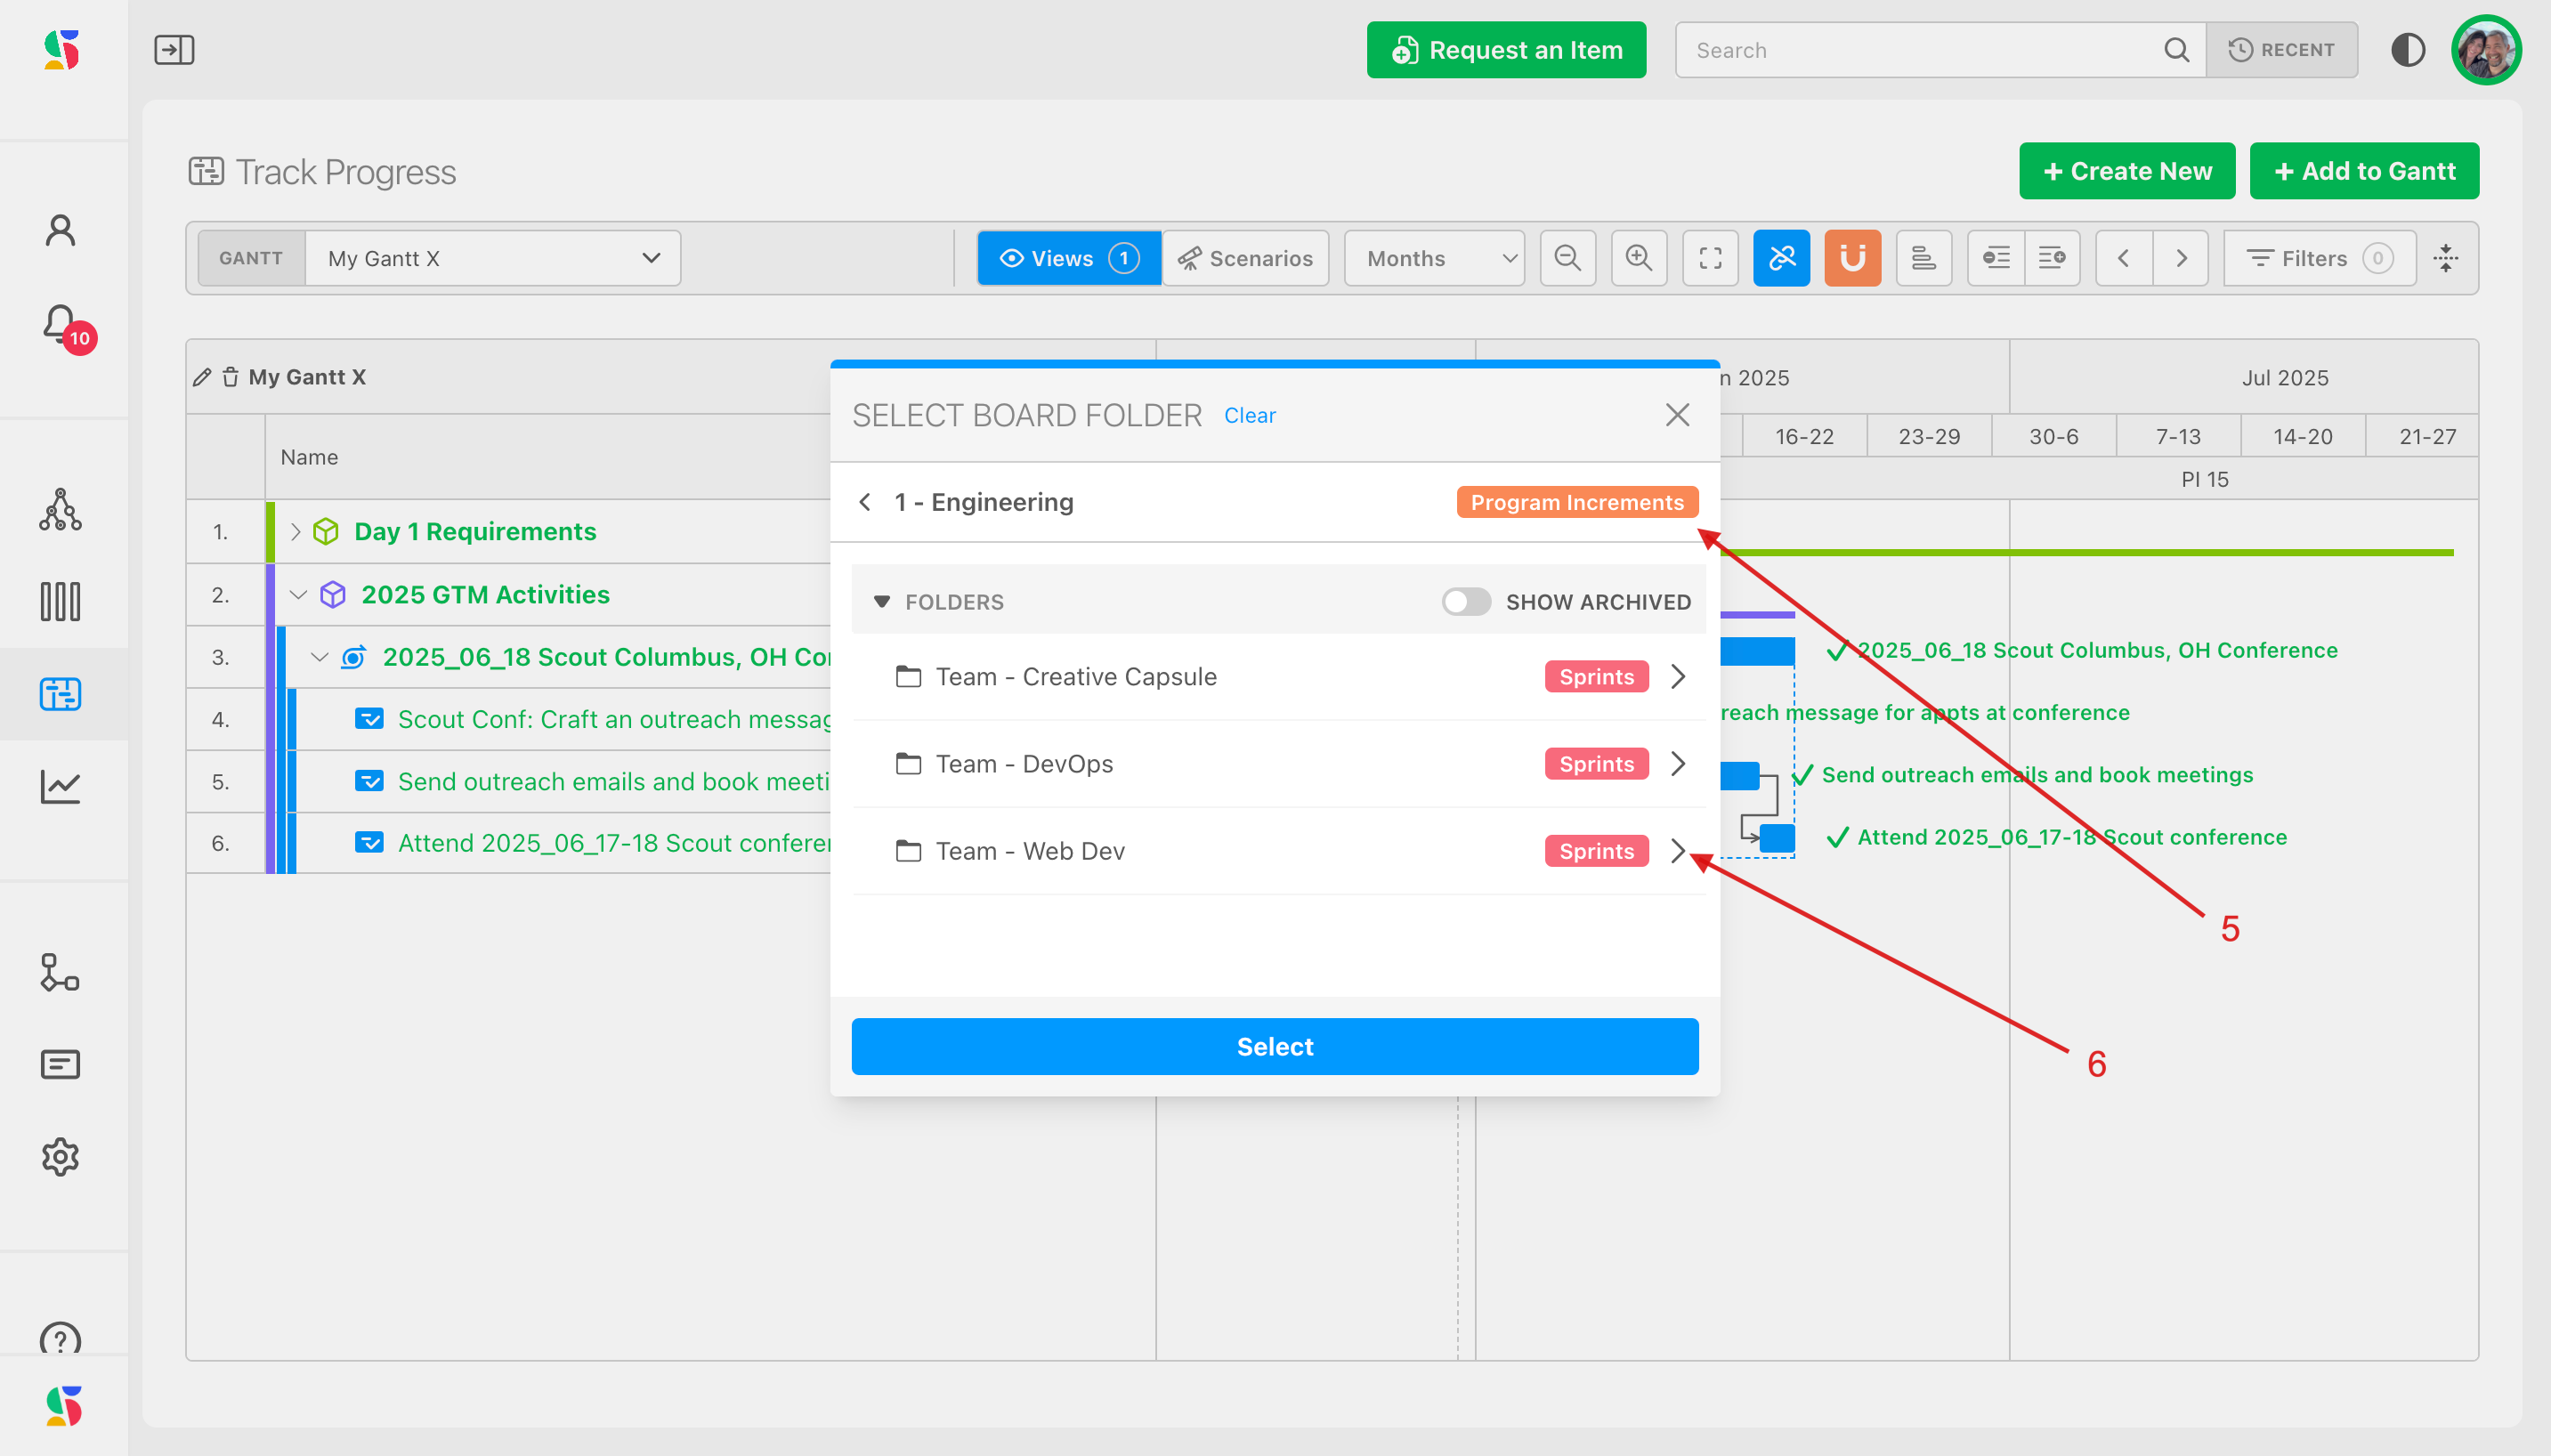
In the gantt example below, we have items from both a Development board (WebDev) and a go-to-market team (GTM). Our GTM team might want to see their dates in light of the development team's cadence. Here's how they would do this, in the model, Navigate to Engineering team's folder name and click the expansion carrot (4).
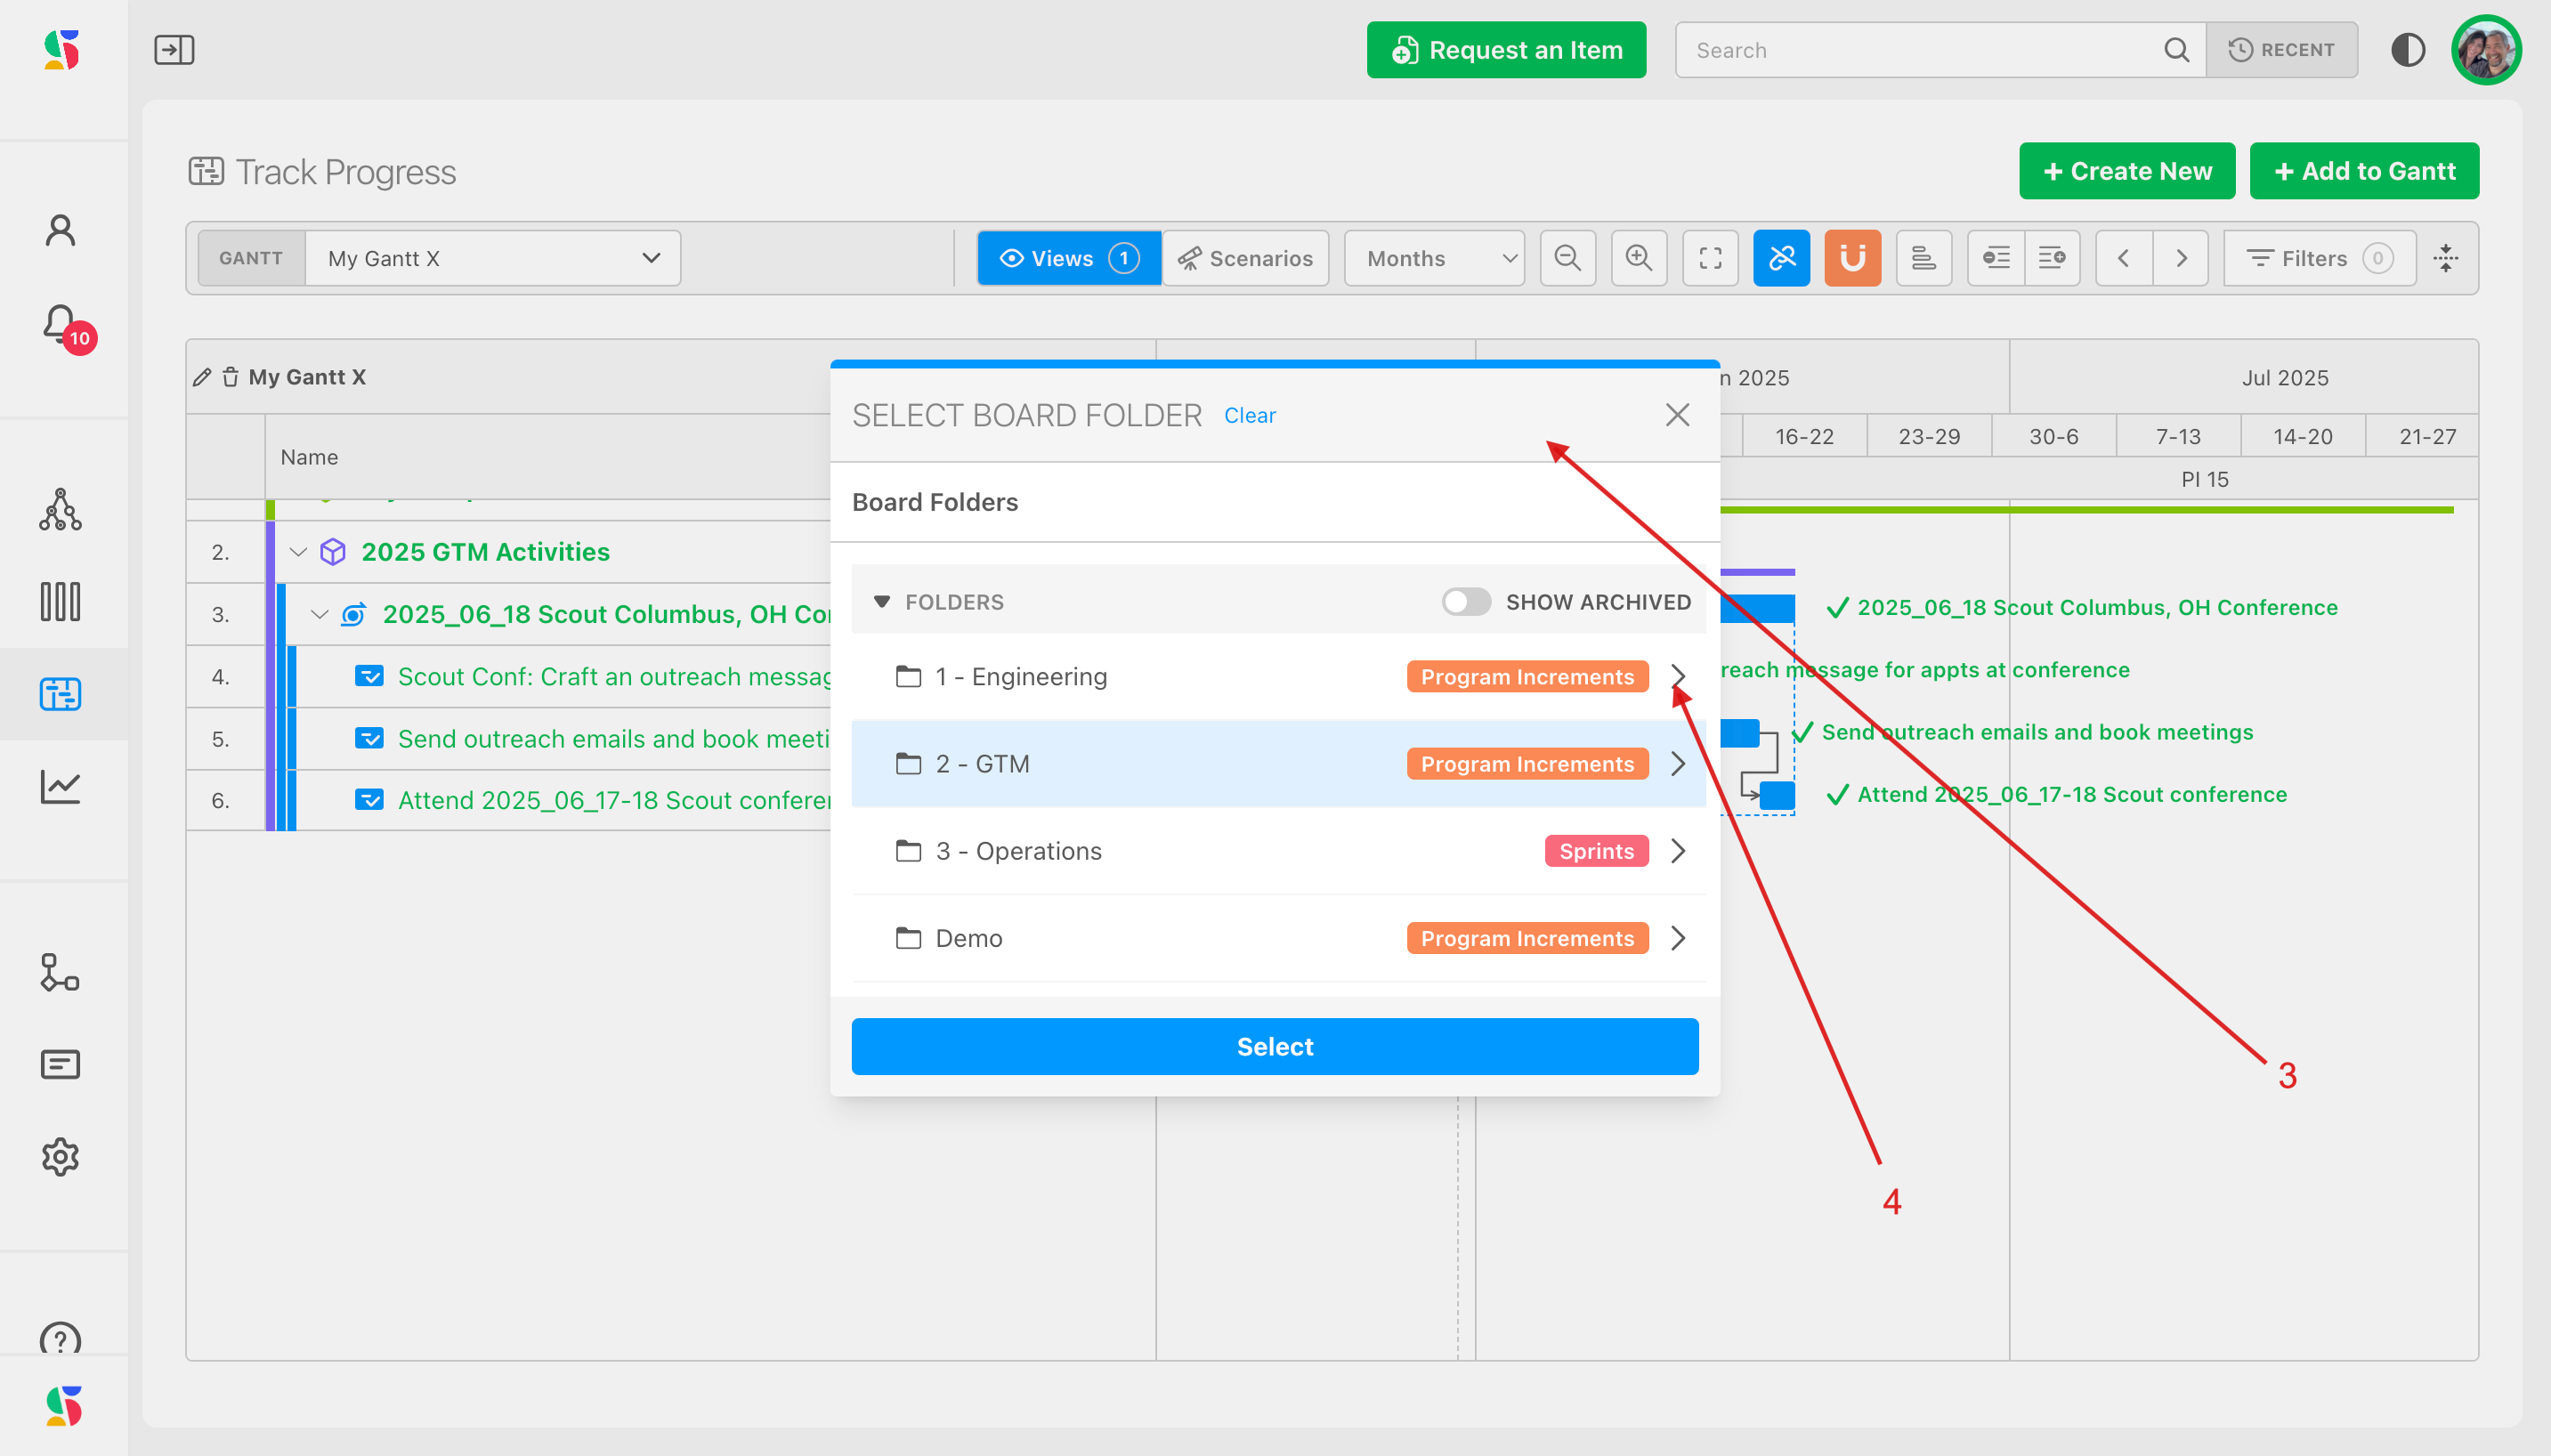
We could choose to see the Engineering group's cycles at the Program Increment (longer cycle for planning) (5) by clicking select or a specific working team's 2 week cycle by exapanding a specific working cycle group's folder underneath - here, we're selecting the WebDev group's 2 week cycle (6):
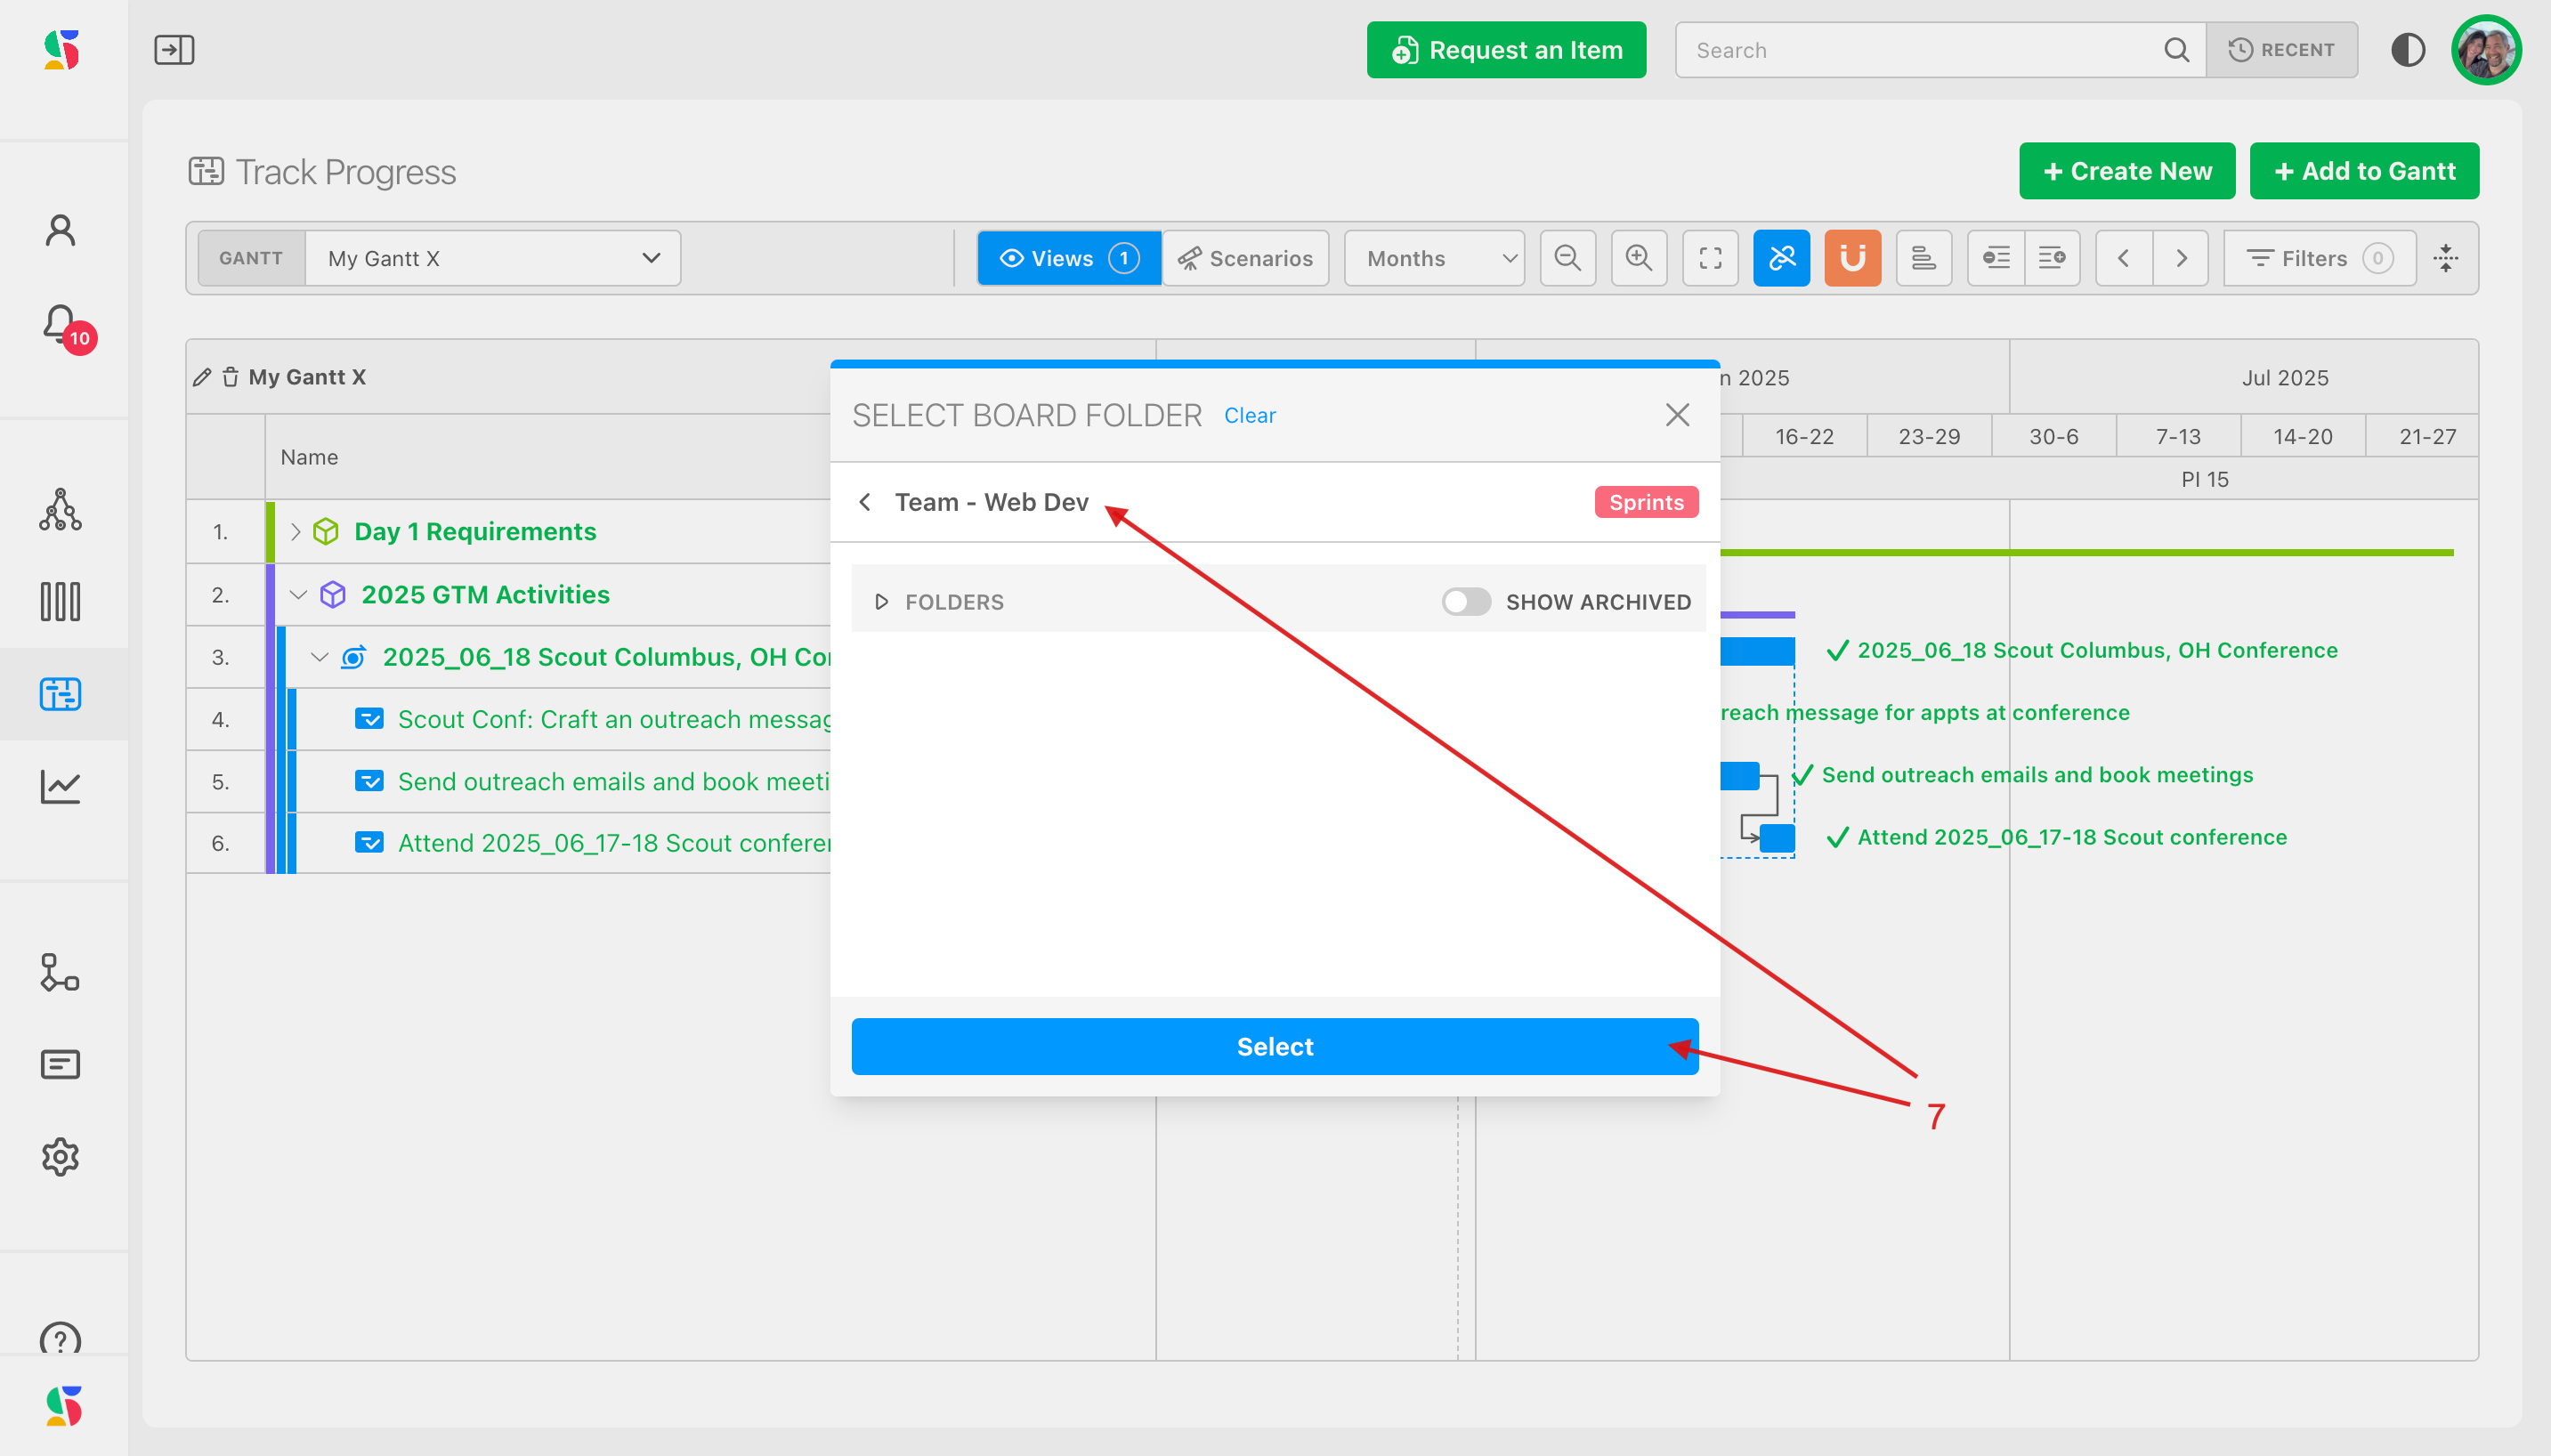
Once you have navigated out to your desired working group's cycle cadence, click Select (7):
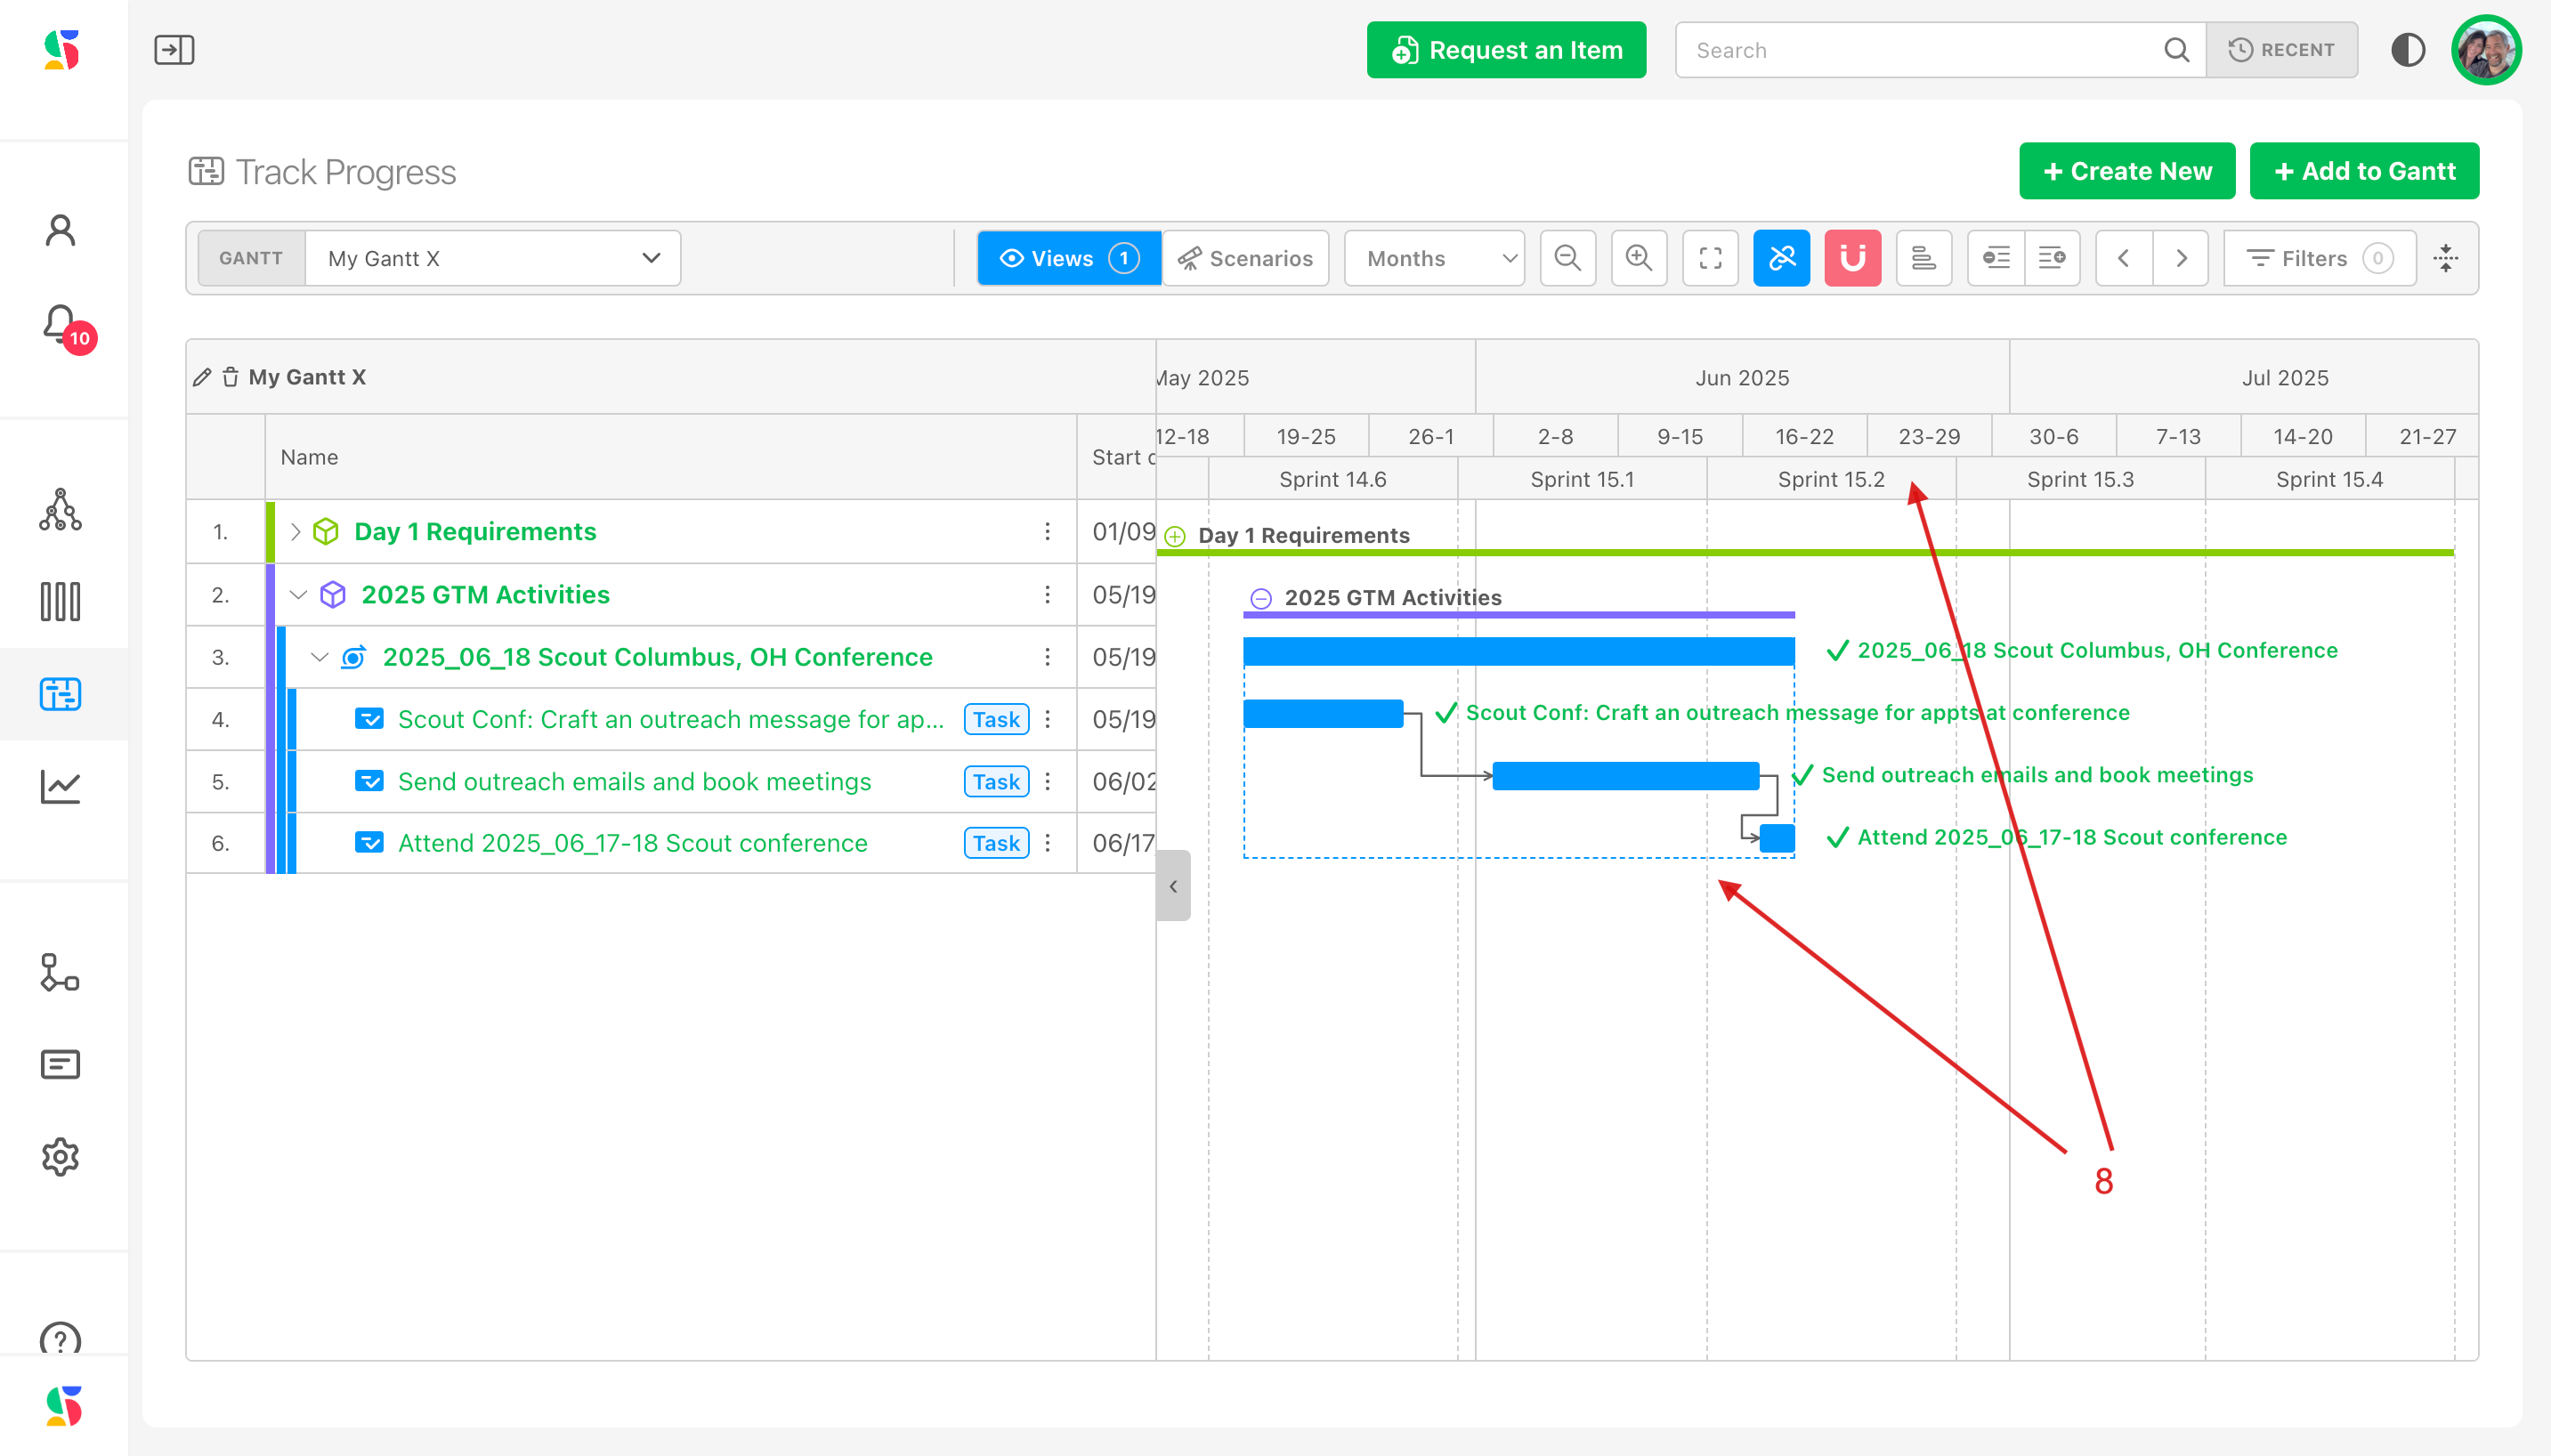
The cadence of that board will appear (8):
Powerful Predictability through Context
Why is this sync to cycle functionality so powerful?
Our example above shows how the user can get context through clear insight into activities, timelines, and deadlines across the organization:
GTM team members can see that most of their GTM activities will happen in Sprint 15.3 of the WebDev's sprint planning cycle.
The actual calendar dates sit right above the sprint information (see 8 in the image above).
You can reset your view to your own sprint anytime through the same workflow, starting with clicking on the snap to cycles icon and then navigating to your team's board folder.
Step 3: Create and track relationships between items, including dependencies
Relationship tracking in DevStride is easy. DevStride provides multiple relationship types:
- Dependency
- Dependent
- Related to
Click any item you wish and link it to its item by clicking on the dot that appears next to its bar. Here, we're creating a dependency from one item to the next item in the due date flow.
You can identify a dependent, a dependency or simply a relationship (something that an item is related to but has no dependency with) using the "related" setting.
"Related" shows that there is an item elsewhere in the system that has some kind of connection - even if just informational - to another item in the scope of the overall project plan.
Here in the Gantt chart, relationships are displayed in a Relationships column in the left pane.
You can also view item relationships many other places in the system, including in Manage Items under the relationship Column or in an Item's workspace drawer by clicking on the Manage Relationship icon (1), as in the example below. The Relationships modal appears (2) providing a summary and detail level along with links to the items listed.
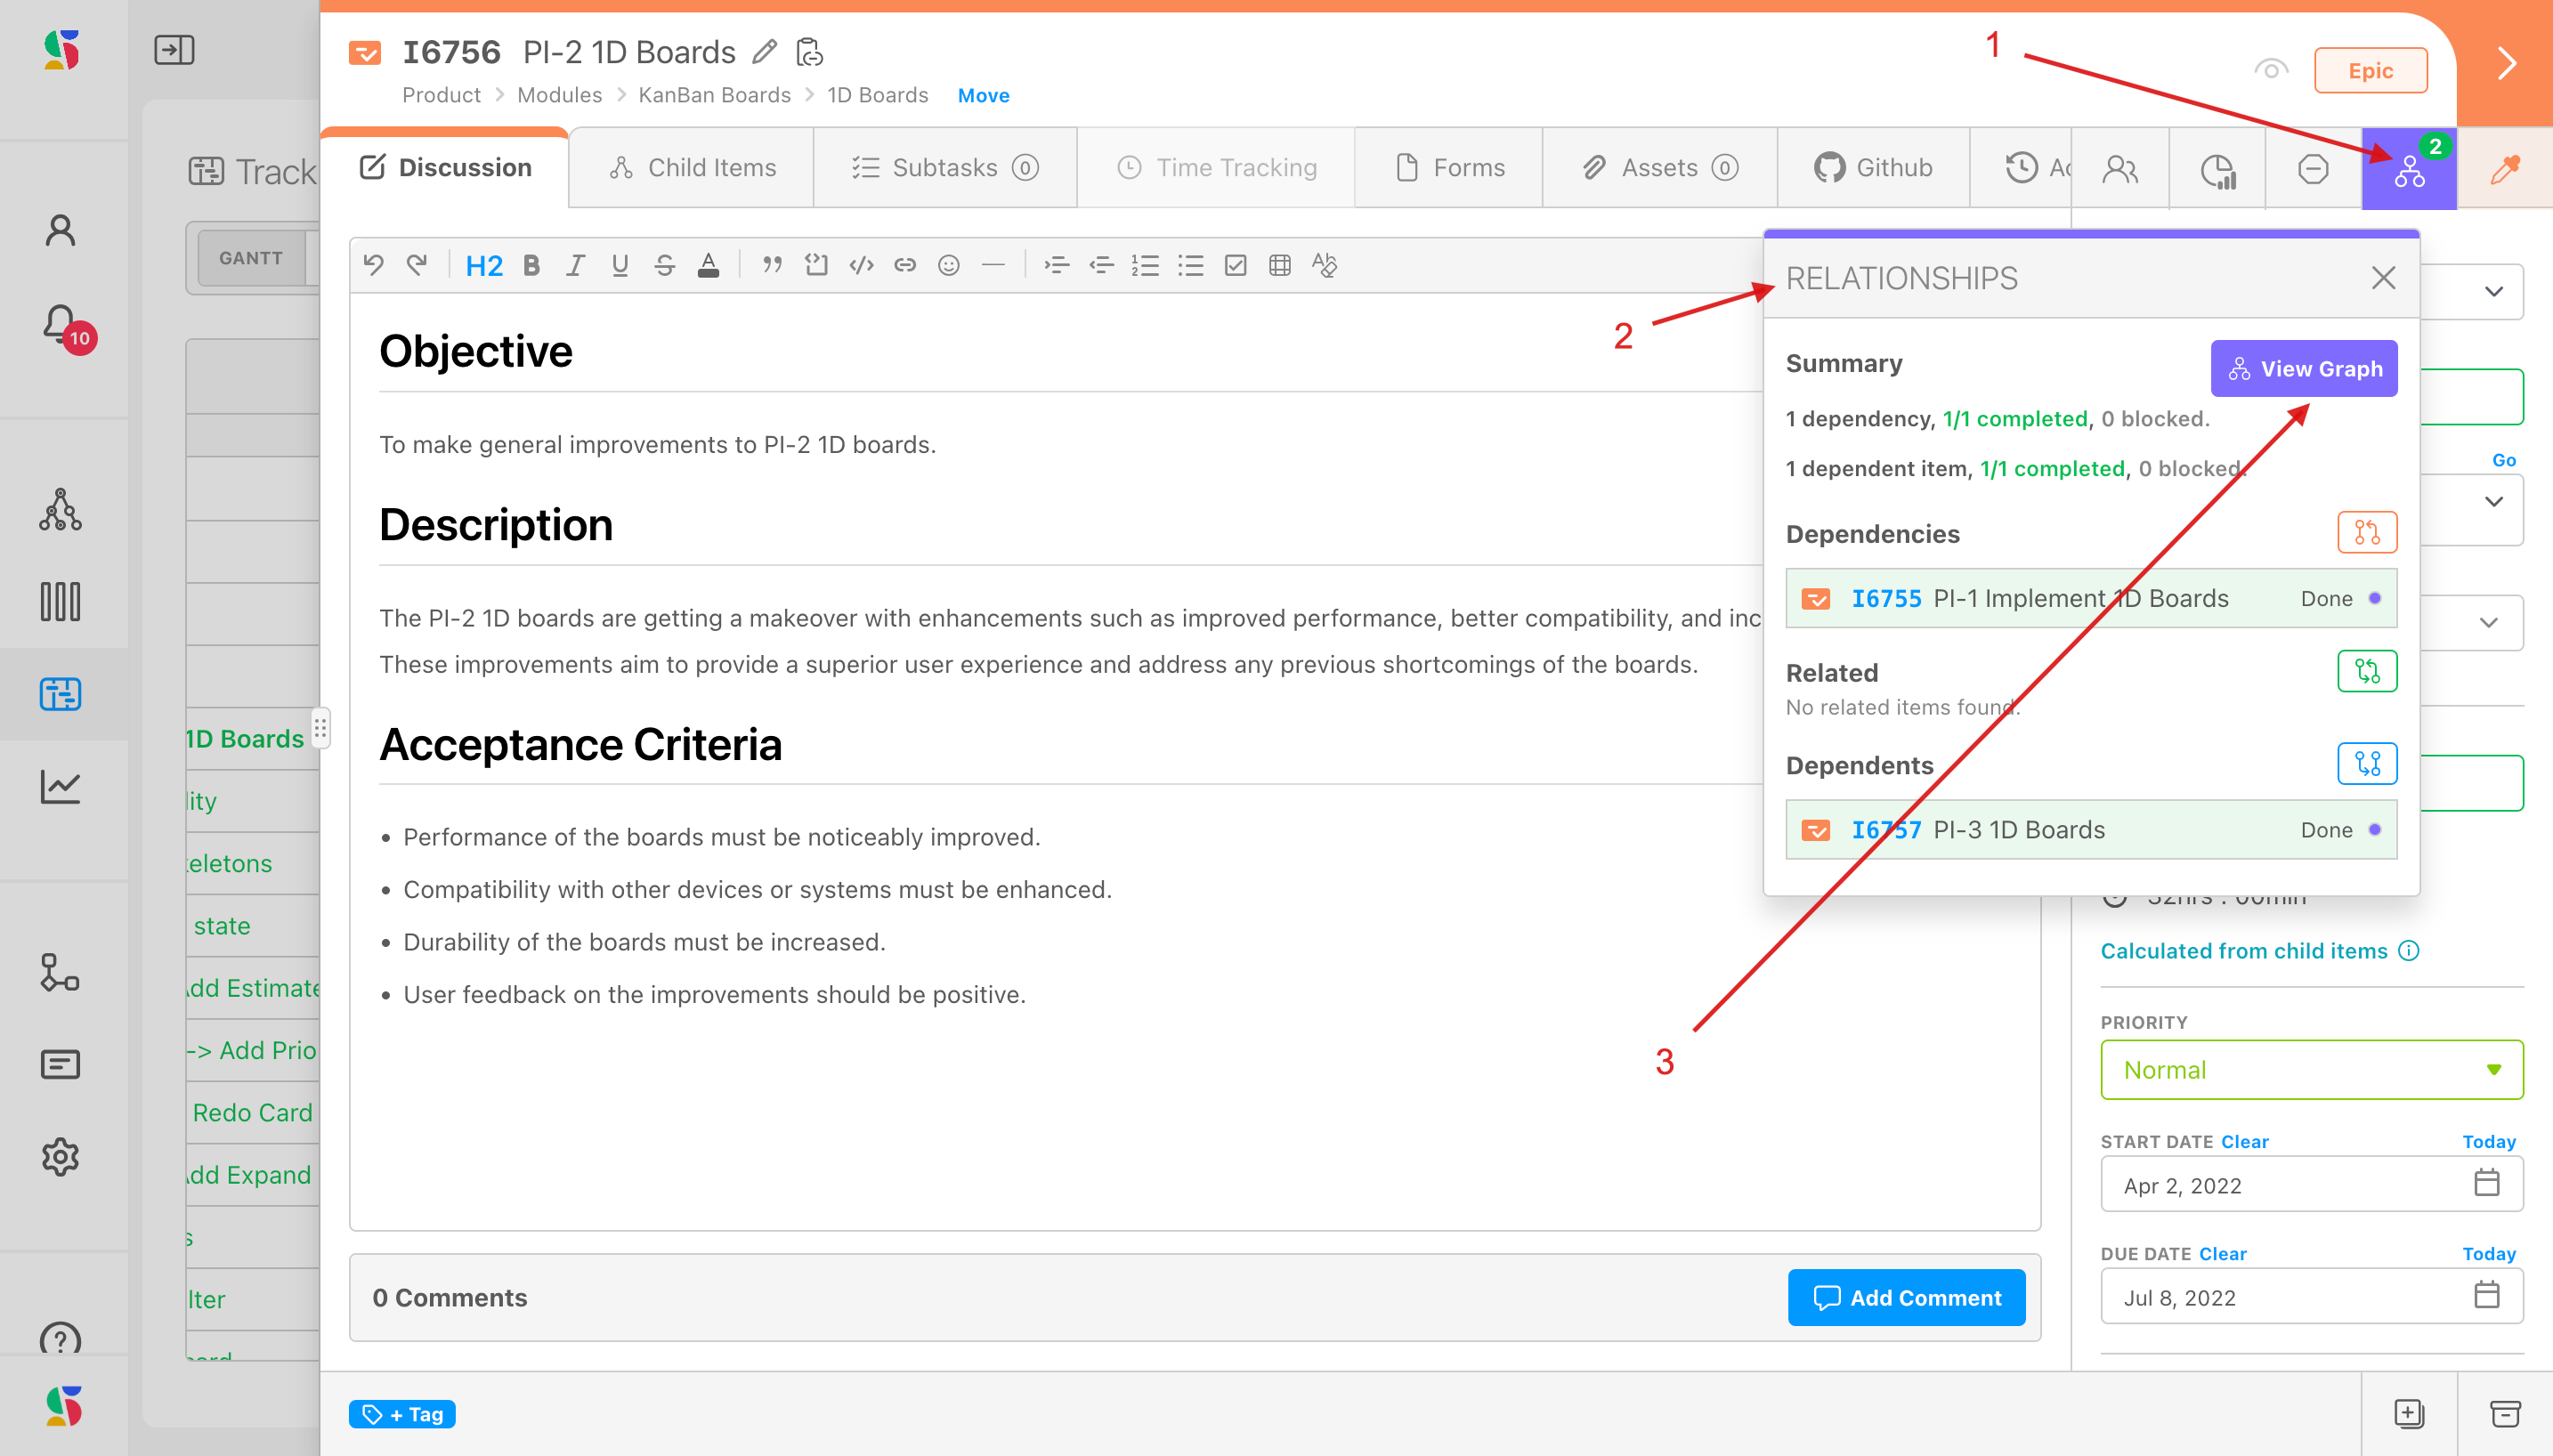
Click View Graph (above, 3) to see a rendering of relationships for the item:
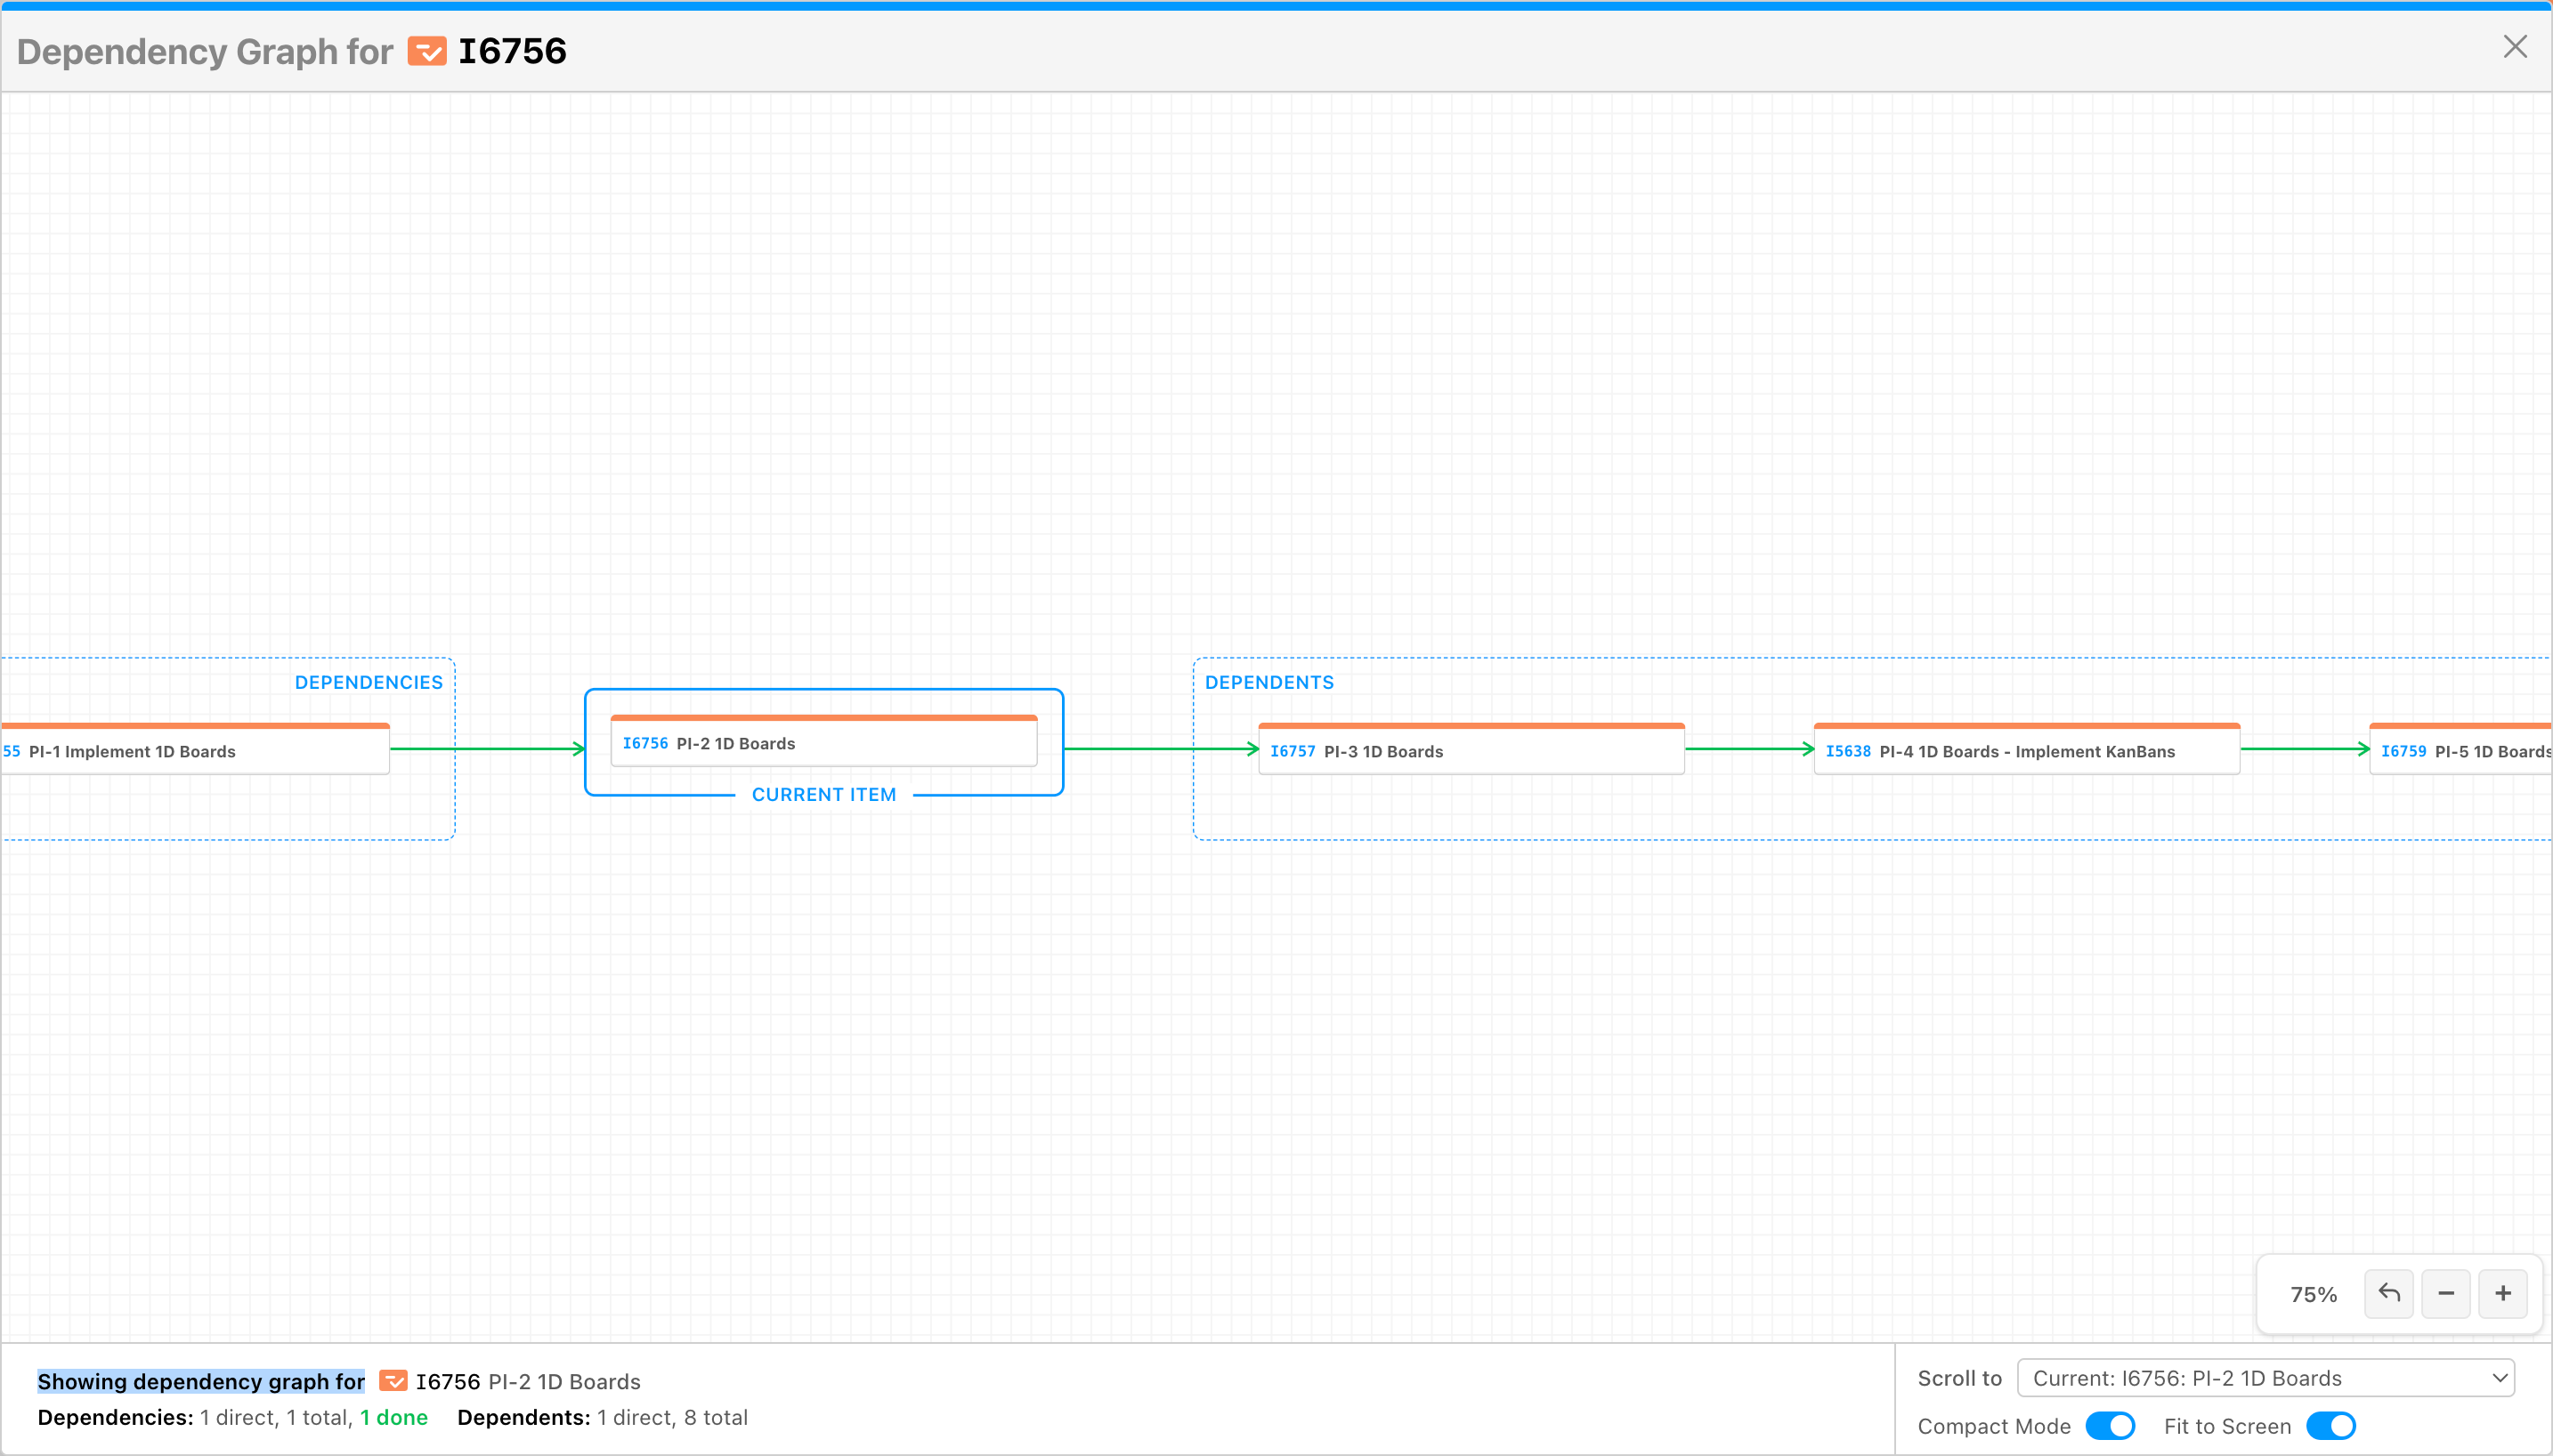
Relationship Management is one more layer of visibility that DevStride can help provide to project teams and stakeholders.
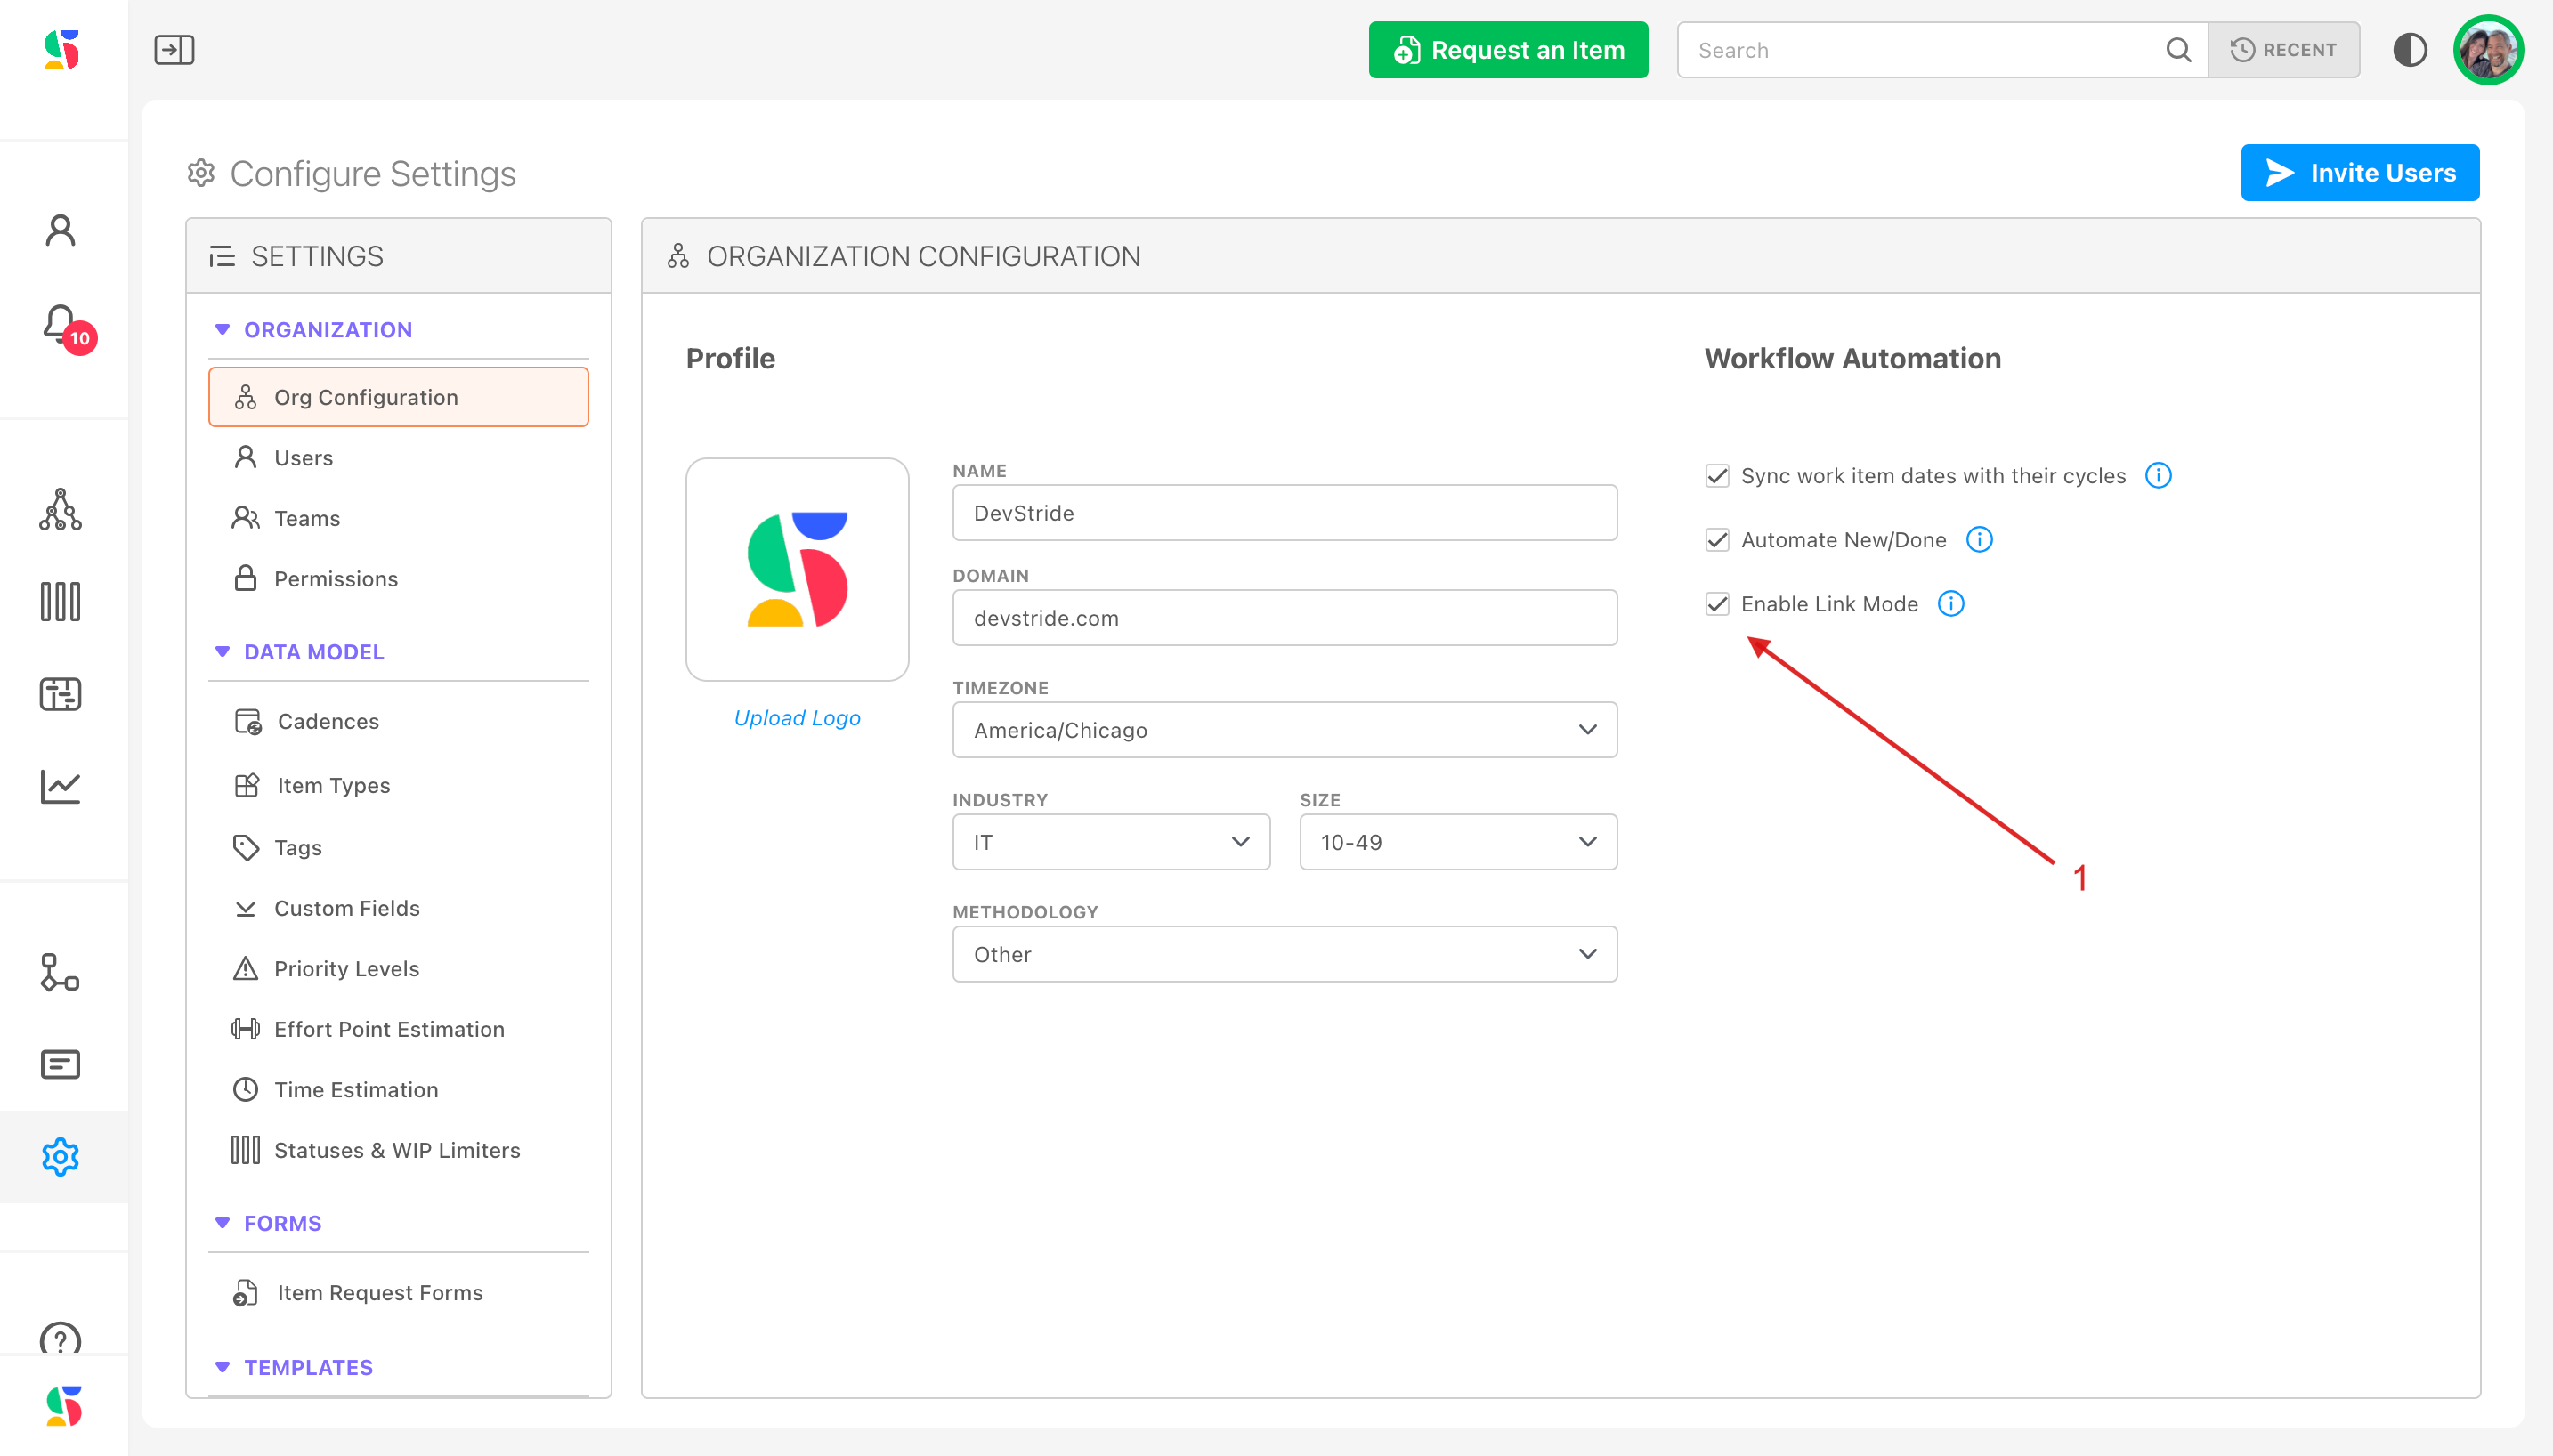
Step 4: Drag and Adjust time, as needed, using linked or unlinked mode.
There are 2 modes you can use when making changes to the timeline grid: unlinked and linked.
Linked mode allows you to propagate changes along any dependency chains.
As you drag and adjust a due dates and duration on the calendar, all the related items are updated accordingly elsewhere.
Unlinked removes the automatic connection.
You can choose the mode you want to use under settings (1):
Was this article helpful?